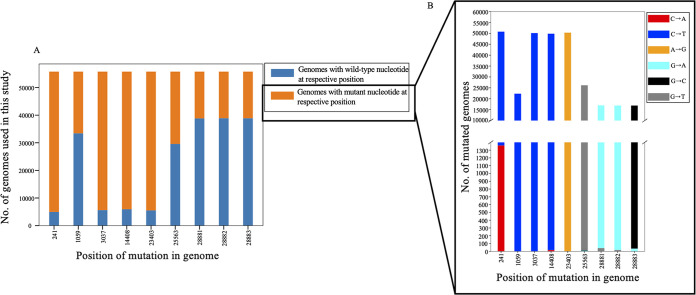
FIG 5.
Stacked bar chart showing the distribution of genomes with a given mutation. (A) The total length of the bar represents the total number of SARS-CoV-2 genomic sequences. The length of the blue bar represents the number of genome sequences with wild-type nucleotides at that position; the length of the orange bar represents the number of genome sequences with a given mutation (mutated nucleotide). (B) Bar length represents the number of genomic sequences that have a mutation at a particular position. A position with a single bar indicates that the wild-type nucleotide is substituted by a single nucleotide. A position with multiple bars indicates that the wild-type nucleotide is substituted by more than one nucleotide. The lengths of the different-color bars represent the degree of substitution.

