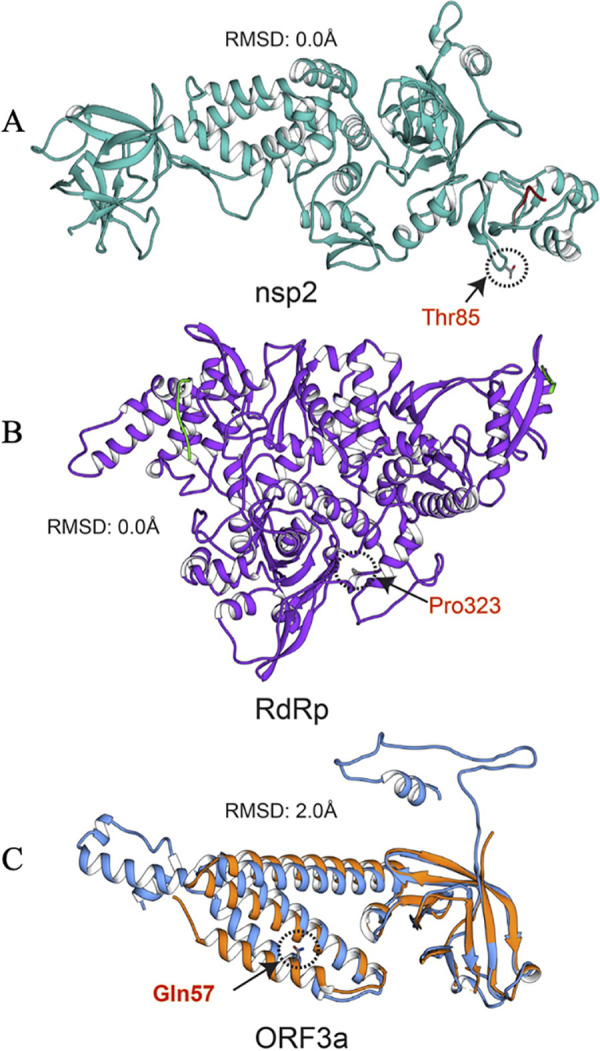
FIG 7.

Structure alignments of crystal structure and the modeled proteins. (A) nsp2 crystal and modeled structures are in cyan and red, respectively. (B) RdRp crystal and modeled structures are in purple and red, respectively. (C) ORF3a crystal and modeled structures are in orange and blue, respectively. Mutation positions are circled, and mutant residues are represented in stick form.
