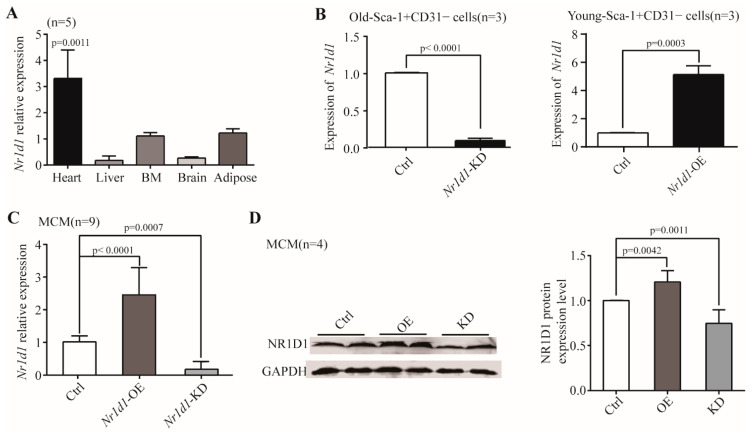
Figure 1.
The expression of Nr1d1. (A) Real-time RT-PCR was used to identify the mRNA expression level of Nr1d1 in aged organs. Each bar represents the fold change of gene expression in aged vs. young mice (n = 5). The expression levels were normalized by Gapdh and the expression level in young mice was used as a calibrator to calculate the fold change. A two-way ANOVA was applied for the analysis. p < 0.05 was considered statistically significant; (B) DD-PCR analysis of Nr1d1 mRNA expression in Sca-1+CD31− cells (n = 3). The left bar graph shows a knockdown of Nr1d1 in the old Sca-1+CD31− cells transduced with Nr1d1-shRNA lentiviral particles (Nr1d1-knockdown), while the right bar graph shows overexpression of Nr1d1 in the young Sca-1+CD31− cells transduced with Nr1d1-cDNA lentiviral particles (Nr1d1-overexpression). The control cell was transduced with an empty lentivector. A two-tailed unpaired t-test was applied for analysis. p < 0.05 was considered statistically significant; (C) real-time RT-PCR analysis of Nr1d1 overexpression in MCM cells transduced with Nr1d1-cDNA lentiviral particles (n = 9). One-way ANOVA was used for analysis. p < 0.05 was considered statistically significant; (D) immunoblot analysis of NR1D1 protein levels in MCM cells transduced with Nr1d1-cDNA lentiviral particles (n = 4). Overexpression and knockdown of Nr1d1 were performed using lentiviral transduction of Nr1d1-cDNA and Nr1d1-shRNA, respectively. The control was transduced with an empty lentivector in MCM cells. The data are from three independent experiments and are presented as mean ± SD. Two-way ANOVA was used to analyze the data. p < 0.05 was considered statistically significant. Statistical analysis was implemented by GraphPad Prism 5. Ctrl: control, KD: knockdown, OE: overexpression.

