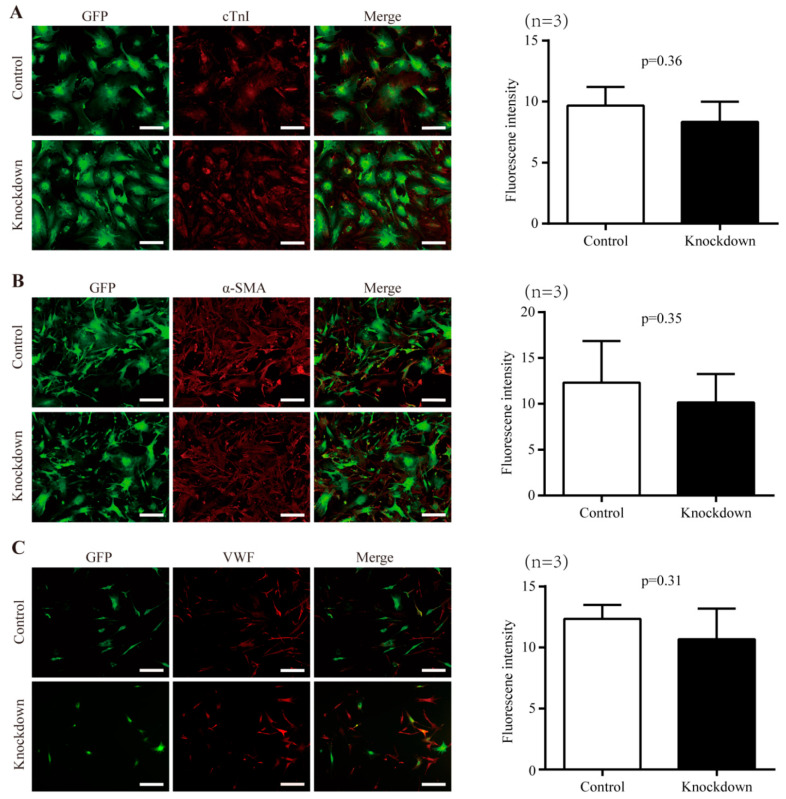
Figure 2.
The effect of Nr1d1 knockdown on cell plasticity. (A–C) cell differentiation of the old Sca-1+CD31− cell after the Nr1d1 knockdown compared to the negative control group. The left panel shows representative immunofluorescence images stained with cardiomyocyte-specific marker cTnI (red) (A), smooth muscle marker α-SMA (B), and endothelial cell marker VWF (C). Sca-1+CD31− cells were marked with GFP merged with DyLight® 550 (red). Scale bars: 50 μm. The bar graph on the right panel depicts the grayscale values of DyLight® 550 within the GFP region as determined by ImageJ and Photoshop, with data from three independent experiments (n = 3) presented as mean ± SD. Two-tail unpaired t-test was used for the analysis method, and p < 0.05 was considered statistically significant.

