Figure 3.
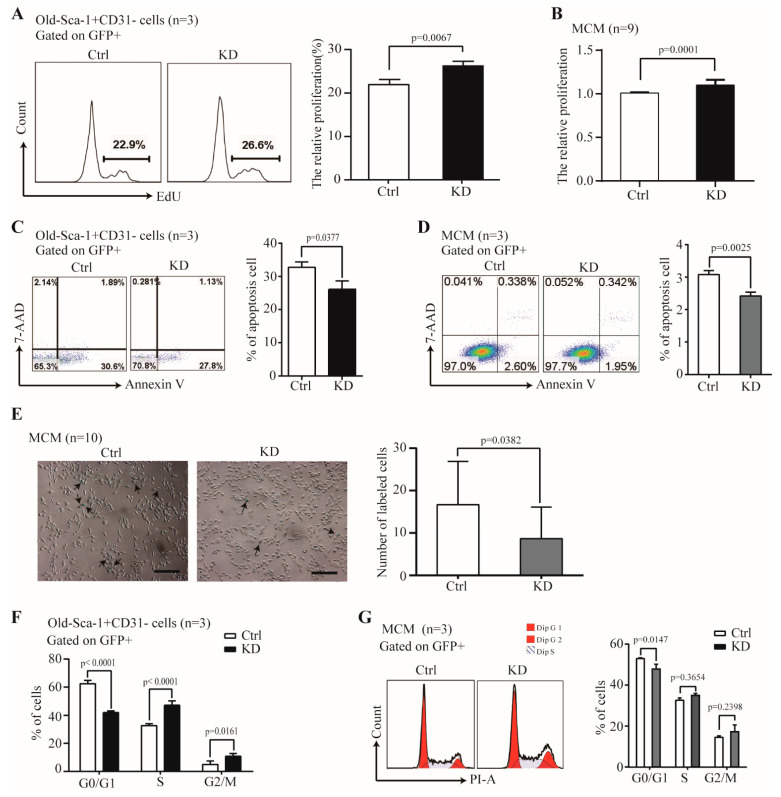
The effect of Nr1d1 knockdown on cell senescence. (A) cell proliferation of old Sca-1+CD31− cells transduced with a Nr1d1-shRNA lentivirus as indicated by the embedding of EdU. The flow cytometric analysis of representative Edu embedding is shown in the left panel, and the bar graph on the right panel is a statistical plot of EdU embedding. The data were from three independent experiments (n = 3). Two-tail unpaired t-test was applied for statistical analysis, p < 0.05 was considered significant; (B) MTT analysis of cell proliferation of MCM transduced with a lentiviral Nr1d1-shRNA. The data were from three independent experiments, and each experiment had three replicates (n = 9). A two-tail unpaired t-test was used for statistical analysis, and p < 0.05 was considered significant. (C,D) Apoptosis rate of the old Sca-1+CD31− cells (C) and MCM (D) transduced with lentiviral Nr1d1-shRNA analyzed by FCM with annexin V-PE/7-AAD staining. The left panel is a representative flow cytometric scatter plot, and the right panel is a bar graph of apoptosis statistics. The data were from three independent experiments (n = 3). A two-tail unpaired t-test was applied for statistical analysis, and p < 0.05 was considered significant; (E) senescence-associated beta-galactosidase staining of MCM transduced with a lentiviral Nr1d1-shRNA. Control cells were transduced with an empty lentivector. The image on the left panel is a representative field of view, scale bars: 50 μm. The bar graph on the right panel shows the number of cells that were stained blue in each random field of view. Each experiment was repeated three times, and 10 random fields of view were counted (n = 10). A two-tail unpaired t-test was used for statistical analysis, and p < 0.05 was considered significant. (F,G) Cell cycle analysis by FCM for the old Sca-1+CD31− (F) and MCM (G) cells transduced with lentiviral Nr1d1-shRNA. The data were collected from three independent experiments (n = 3), two-way ANOVA was applied for statistical analysis, and p < 0.05 was considered significant. All data in the bar graph were presented as mean ± SD. Ctrl: control, KD: knockdown.

