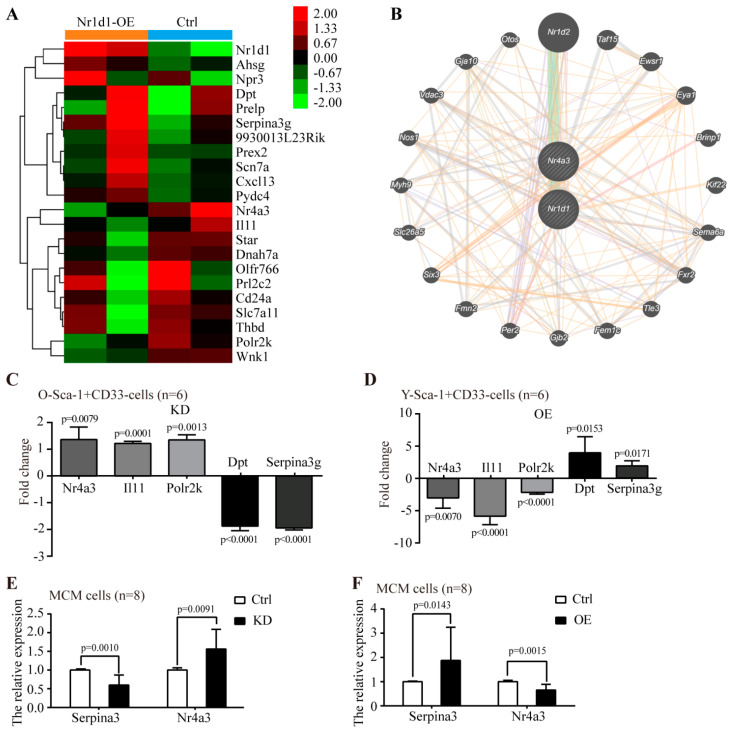
Figure 6.
The effect of altered Nr1d1 expression levels on gene expression profiles. (A) the differentially expressed genes identified by a microarray in Young Sca-1+CD31− cells comparing the Nr1d1-cDNA-infected cells and negative control. The tree was based on log2 transformation of normalized probe signal intensity using hierarchical clustering. Red: upregulated gene expression; Green: downregulated gene expression. Every sample was tested twice. A total of 22 differentially expressed genes were identified via pairwise comparison. (B) Interaction relation of differentially expressed genes by generadar (https: //www.gcbi.com.cn/gcanalyze/html/generadar/index, accessed on 8 June 2020). (C,D) differentially expressed genes detected by real-time RT-PCR after Nr1d1 knockdown (C) and overexpression (D) in Sca-1+CD31− cells; data were from three independent experiments, and each experiment had two replicates (n = 6). (E,F) Differentially expressed genes detected by real-time RT-PCR after Nr1d1 knockdown (E) and overexpression (F) in MCM. Expression levels were normalized by Gapdh, and expression levels in the negative control were used as a calibrator to calculate fold changes. Calculated difference change based on a mean of three independent experiments, and each experiment had at least two replicates (n = 8). The ΔΔCT values were subjected to unpaired Student’s t-test implemented using Prism software. Bars above and below the x-axis show genes that are up- or downregulated, respectively. All data in bar graph presented as mean ± SD, and two-way ANOVA was used as statistical analysis, and p < 0.05 was considered significant. Ctrl: control, KD: knockdown, OE: overexpression.

