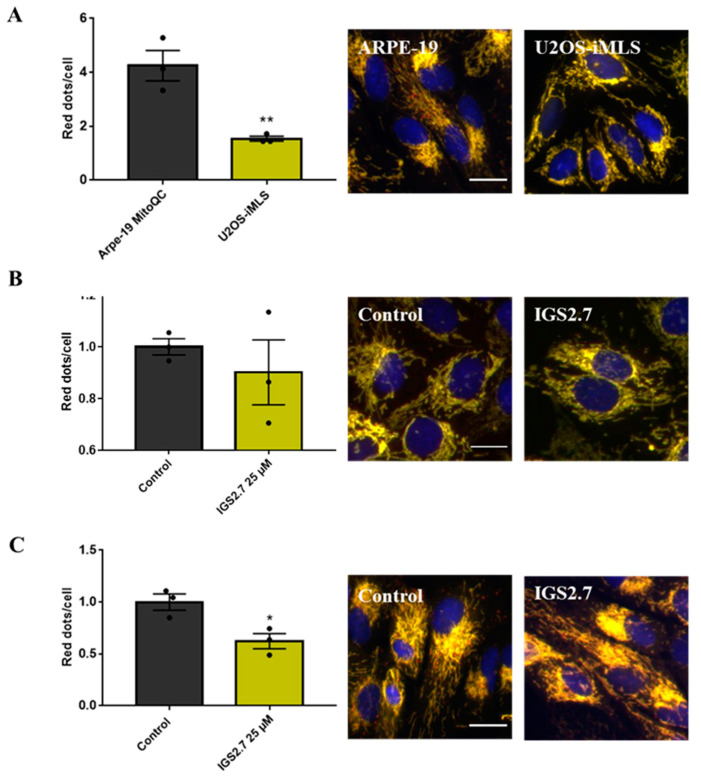
Figure 4.
Basal mitophagy in ARPE-9 MitoQC and U2OS-iMLS cells and its modulation by IGS2.7. Representation and quantification of mitophagy in (A) ARPE-19 MitoQC and U2OS-iMLS cells, (B) U2OS-iMLS cells, and (C) ARPE-19 MitoQC cells treated with control and 25 μM IGS2.7 for 24 h. Data represent the mean ± SEM of three independent experiments. Data from (B,C) were normalized to control (significance was determined by unpaired two tailed t-test, where ** p < 0.01 indicates a significant difference between samples and * p < 0.05 indicates a significant difference from control). Scale bar = 20 µm.

