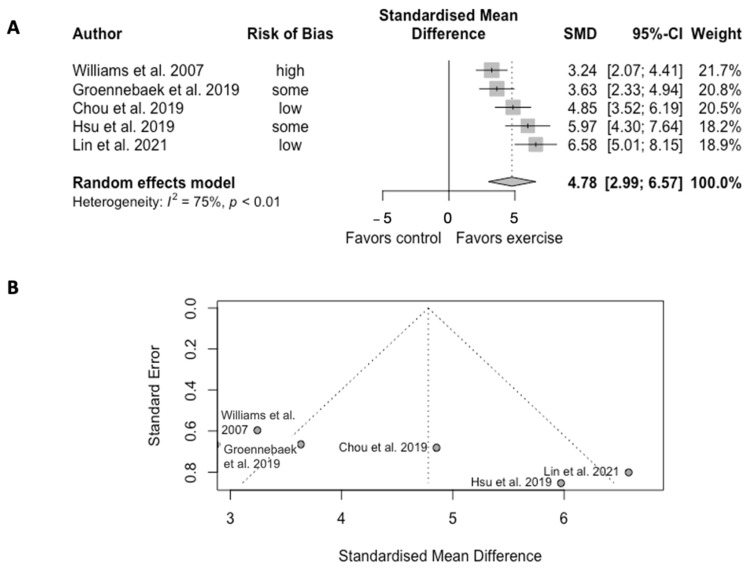
Figure 2.
(A) Forest plot of effect sizes and 95% confidence intervals representing oxidative capacity, based on the random effects meta-analysis results. (B) Funnel plots of publication bias. Abbreviation: SMD, standardized mean difference. Williams et al. [38], Groennebaek et al. [32], Chou et al. [22], Hsu et al. [19], and Lin et al. [20].

