Figure 2.
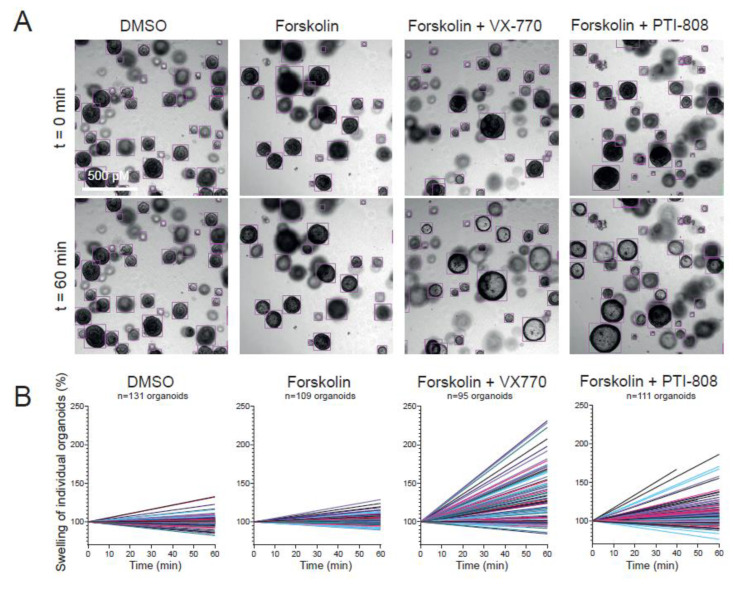
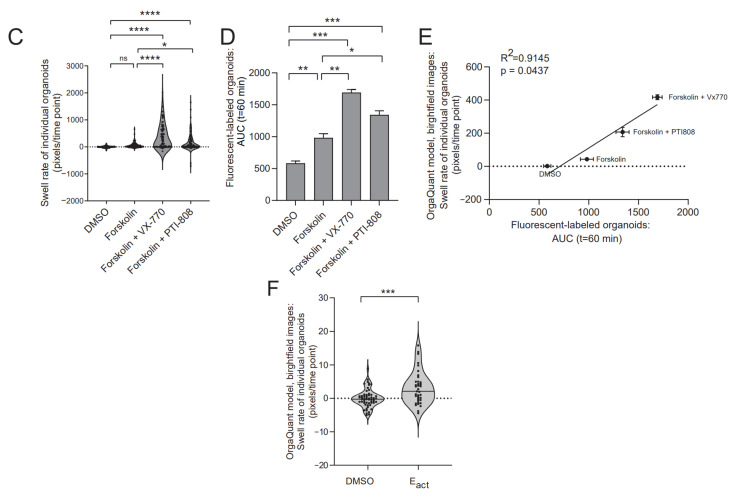
Quantification of nasal organoid swelling in a 384-well plate format by the OrgaQuant neural network. (A) Representative brightfield images showing automatic recognition of CF nasal organoids (F508del/S1251N) with the OrgaQuant model [18]. To examine swelling, organoids were treated with the vehicle DMSO, forskolin alone (5 µM) or a combination of forskolin (5 µM) with the CFTR potentiators VX-770 (5 µM) or PTI-808 (1 µM); (B) graphs show percentage change in surface area relative to t = 0 (100%) of individual organoids, treated with vehicle DMSO, forskolin, forskolin with VX-770 or forskolin with PTI-808, corresponding to the wells from (A). Each line represents an individual organoid; (C) swell rates (pixels/time point) of individual organoids from the wells shown in (A) are displayed (one representative well per condition is shown); (D) analysis of FIS using the conventional quantification method in fluorescent-labeled organoids, using the same donor as in (A–C) (n = 1 donor, F508del/S1251N, 2 biological replicates). Organoids were treated with vehicle DMSO, forskolin (5 µM), forskolin with Vx770 (5 µM) or forskolin with PTI-808 (1 µM). AUC is used as outcome measurement for organoid swelling; (E) correlation between two analysis methods for FIS in a similar donor: in the new developed method, organoids in brightfield images are recognized using OrgaQuant and swell rate (pixels/time point) is used as outcome measurement for swelling. In the conventional method, fluorescent-labeled organoids are recognized with image software Zen Blue and AUC values are used as outcome measurement for swelling; (F) swell rates of individual organoids within a single well stimulated with DMSO or Eact (10 µM) in a CFTR-null donor (1811+1G>C/1811+1G>C). Analysis of differences was performed using unpaired t-tests (F), one-way ANOVA wit Tukey post hoc test (C,D) or Pearson correlation (E). ns = non-significant, * p < 0.05, ** p < 0.01, *** p < 0.001, **** p < 0.0001.


