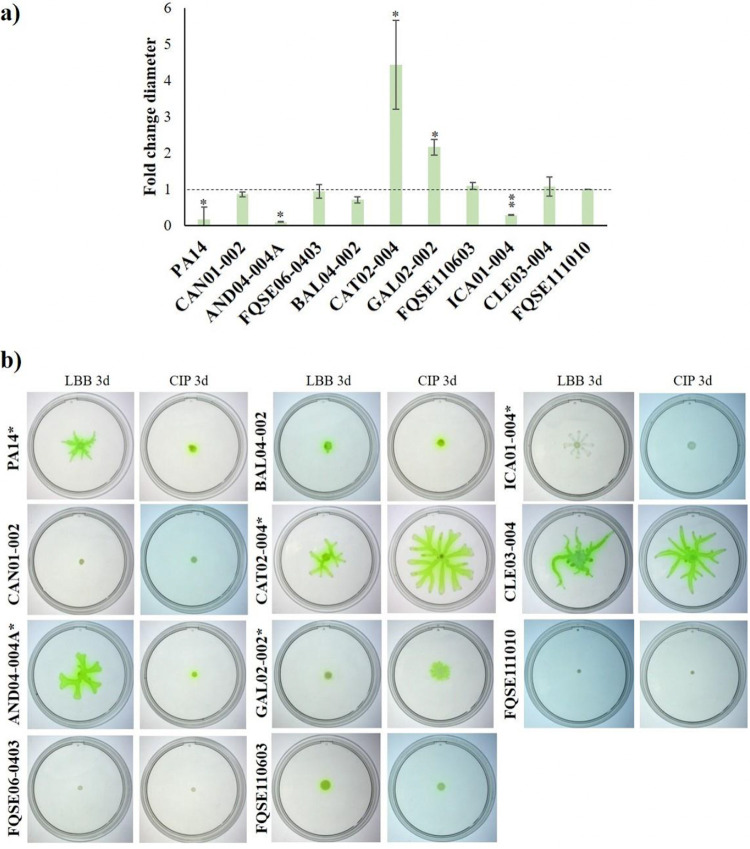
FIG 6.
Motility phenotypes of P. aeruginosa clinical isolates evolved under ciprofloxacin risk concentration. (a) The graph depicts the relative diameters of swarming zones in P. aeruginosa PA14 and 10 clinical isolate populations evolved under 0.04 μg/mL of ciprofloxacin for 3 days, with respect to the ones evolved in LBB for the same interval (dotted line). (b) The pictures include the ciprofloxacin-evolved replicates (CIP 3d) and LBB-evolved ones (LBB 3d). Error bars indicate standard deviations from three independent experiments, and statistically significant differences were assessed using the Student’s t test and are shown (*, P < 0.05; **, P < 0.005), both in the graph and the images.

