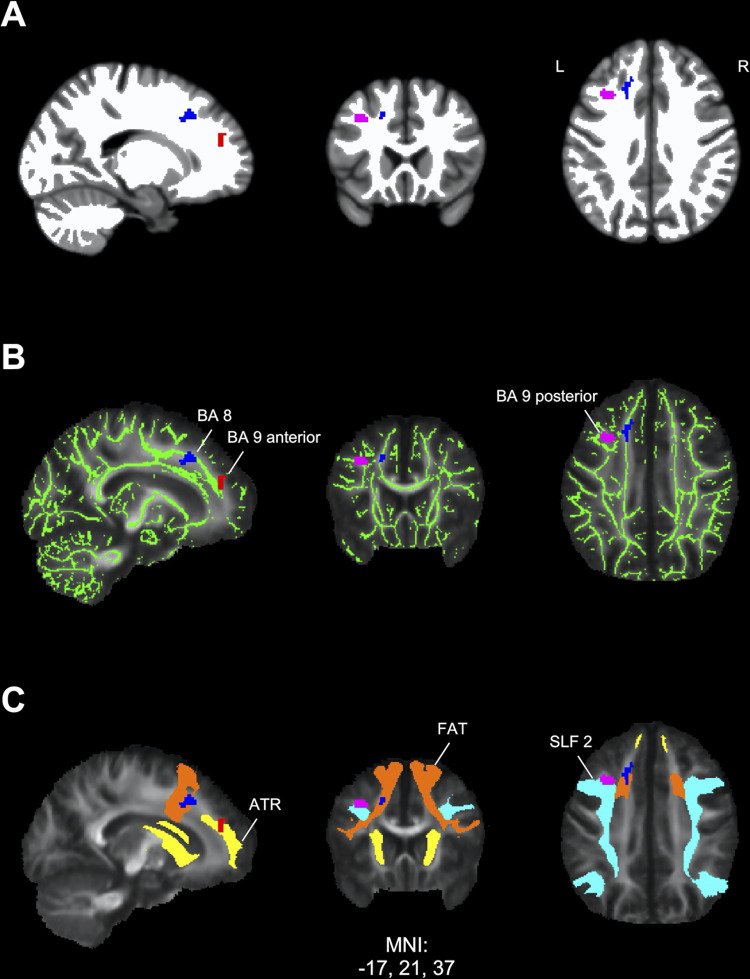
Fig 3. Localization of frontal task-related fMRI activations in white matter.
Significant frontal clusters of elevated activation in PTLD participants compared to controls from the contrast values of the forward minus control conditions were transformed into binary regions of interest (ROIs) labeled by their Brodmann area location. Blue: Brodmann area 8 (BA 8) ROI, red: Anterior Brodmann area 9 (BA 9 anterior) ROI, pink: Posterior Brodmann area 9 (BA 9 posterior) ROI. Labeled ROIs were used to compute the percent overlap with each of the following measures. (A) White matter mask (white) derived from a study-specific T1 template using tissue class segmentation analysis. The BA 8 ROI showed 80.06% overlap, the BA 9 anterior ROI showed 89.39% overlap, and the BA 9 posterior ROI showed 99.73% overlap with white matter. (B) Mean fractional anisotropy (FA) and white matter skeleton (green) maps derived using diffusion tensor imaging (DTI) analysis showing overlap with fMRI ROIs. The BA 8 ROI showed 25.00% overlap, the BA 9 anterior ROI showed 22.35% overlap, and the BA 9 posterior ROI showed 24.46% overlap with skeletonized white matter. For reference, the white matter skeleton accounts for 34.47% of the overall white matter mask from the tissue class segmentation. (C) Mean FA map overlaid with three long range white matter pathways obtained from DTI. The BA 8 ROI showed 41.57% overlap with the frontal aslant tract (FAT; orange), the BA 9 anterior ROI showed 49.62% overlap with anterior thalamic radiation (ATR; yellow), and the BA 9 posterior ROI showed 57.61% overlap with the superior longitudinal fasciculus 2 (SLF 2; cyan). L = left, R = right hemispheres.

