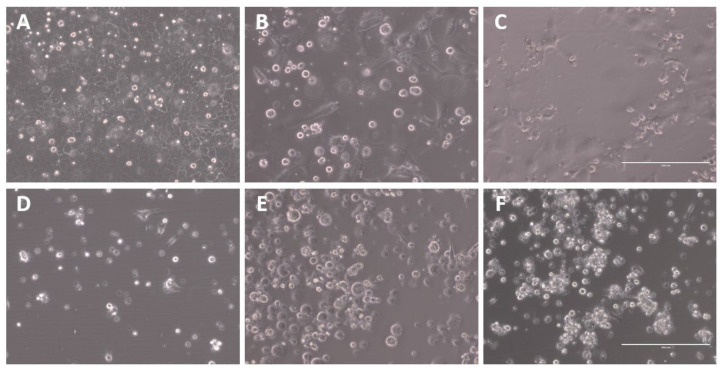
Figure 1.
Representative images of viral CPE of A/Singapore/G2-31.1/2014 infection of MDCK-SIAT1 and CEF cells at 3 days post-infection (dpi). Microscopic images were captured using the EVOS XL microscope at 20× magnification. The scale bar (bottom right) represents 200 µm. (A) Uninfected MDCK-SIAT1 and infected MDCK-SIAT1 cells at (B) P1 and (C) P5. (D) Uninfected CEFs and infected CEFs at (E) P1 and (F) P5.

