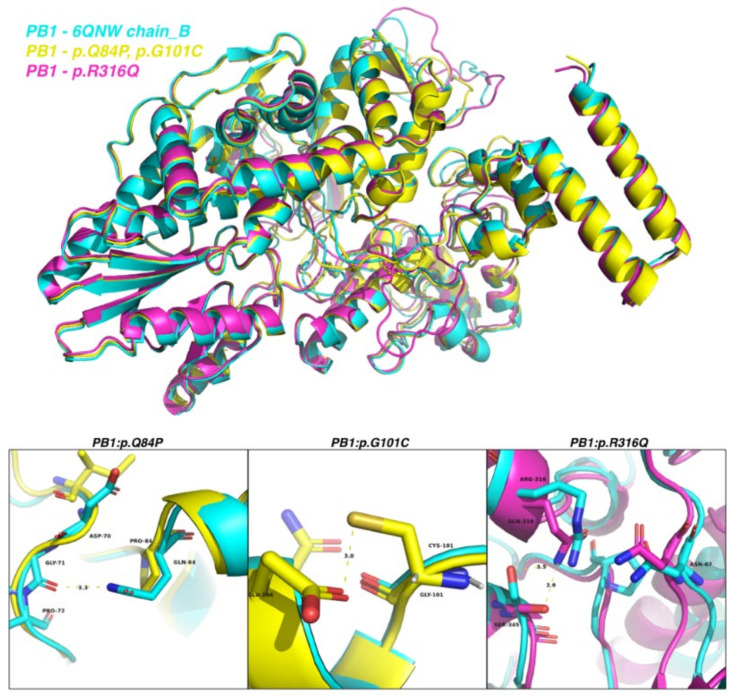
Figure 8.
The superimposed structures of the PB1 protein of A/Northern Territory/60/1968 (cyan), PB1 with the Q84P and G101C mutations (yellow), and PB1 with the R316Q mutation (magenta). Magnified views of residues 84, 101, and 316 are depicted in the lower panel. Residues 84, 101, and 316 and their nearby residues are labeled in black, together with the distances in Angstrom (Å) units.

