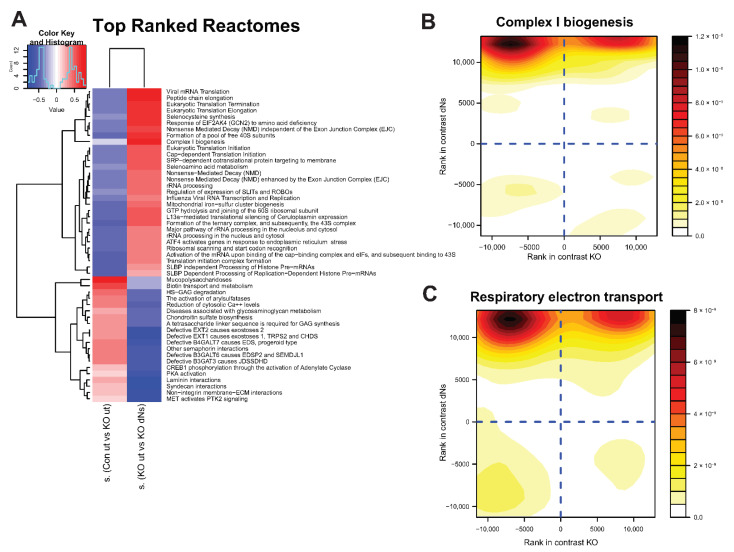
Figure 3.
dNs stimulate genes involved in complex I biogenesis and respiratory electron transport in ECHS1 KO cells. (A) Heat map showing enrichment scores of gene sets selected by discordance between comparison of untreated control cells (CON ut) and untreated ECHS1 KO (ut) cells (left column), with comparison of untreated ECHS1 KO cells (ut) and dNs treated ECHS1 KO cells (dNs) (right column), as ranked by effect size (s.dist). Blue indicates gene sets that are downregulated, red indicates gene sets that are upregulated. Complex I biogenesis is a key gene set that was downregulated in ECHS1 KO cells (blue, left column) but increased following dNs treatment (red, right column). (B) Contour density plot showing discordant regulation of gene set members of complex I biogenesis. X axis shows rank in comparison between untreated ECHS1 KO cells and untreated CON cells, Y axis shows rank in comparison between untreated and dNs treated ECHS1 KO cells. Shading represents density of genes within section of graph. Darker colours indicate higher intensity. (C) Contour density plot showing discordant regulation of gene set members of respiratory electron transport. X axis shows rank in comparison between untreated ECHS1 KO cells and untreated CON cells, Y axis shows rank in comparison between untreated or dNs treated ECHS1 KO cells. Shading represents density of genes within section of graph. Darker colours indicate higher intensity.

