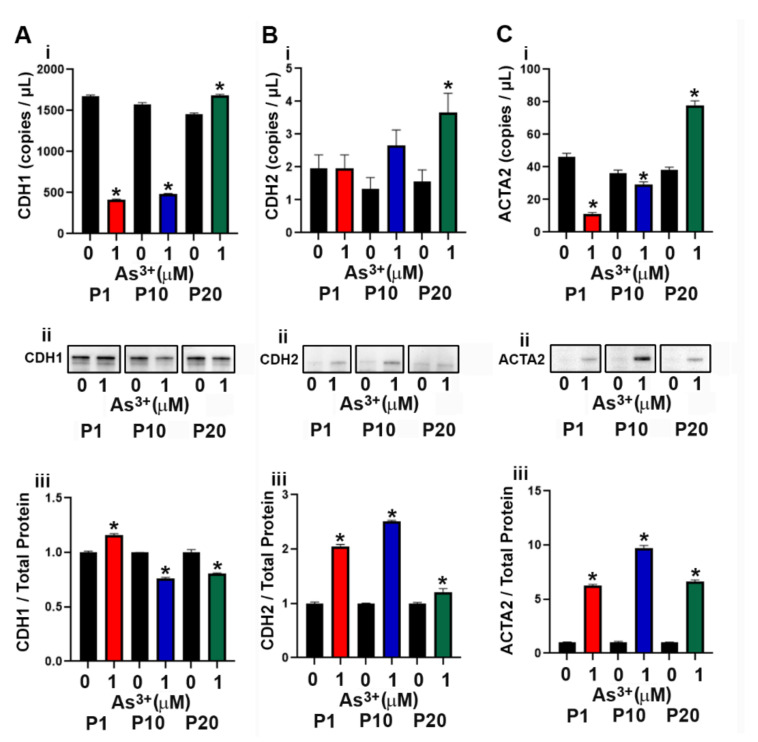
Figure 4.
Expression of epithelial to mesenchymal transition (EMT) markers in RT4 cells exposed to As3+. (Ai–Aiii) CDH1 expression, (Bi–Biii) CDH2 expression, and (Ci–Ciii) ACTA2 expression in parent and 1 µM As3+-exposed RT4 cells at passages 1, 10, and 20 (P1, P10, and P20). Images are cropped to show relevant bands. Uncropped Western blots are shown in Supplementary Figure S2. Droplet digital PCR (ddPCR) analysis was performed to verify gene expression (Ai–Ci). Western blot analysis was used to measure protein levels (Aii–Cii) and the integrated optical density (IOD) of each protein band was calculated (Aiii–Ciii). Gene expression is reported as copies per µL and protein expression was normalized to total protein per lane and then plotted as fold-change compared to the parent. Triplicate measurements of gene and protein data were performed and are reported as mean ± SEM. An unpaired t-test was performed. Asterisks indicate significant differences from the passaged-matched parent (p < 0.05).

