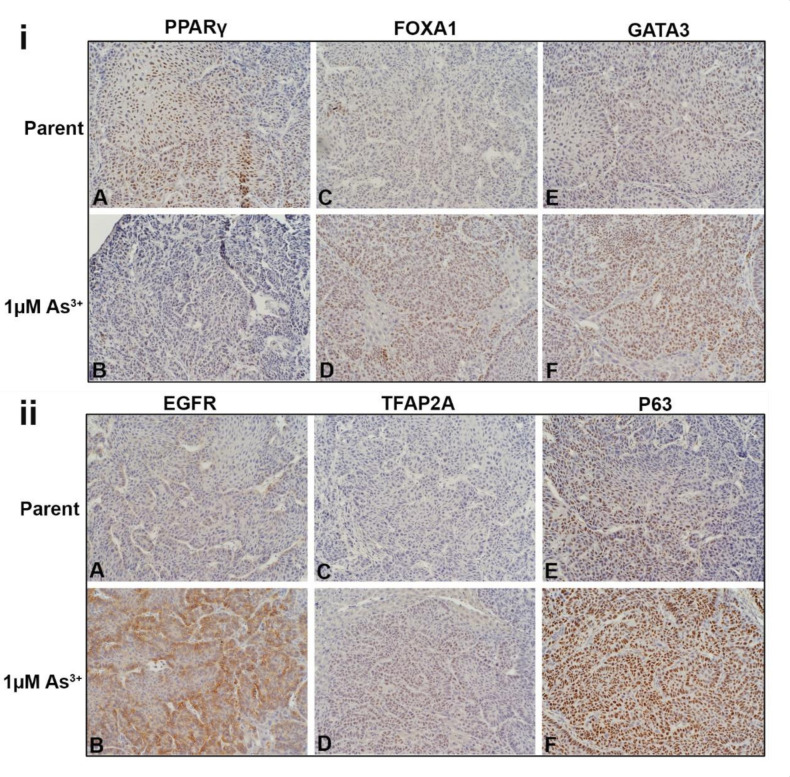
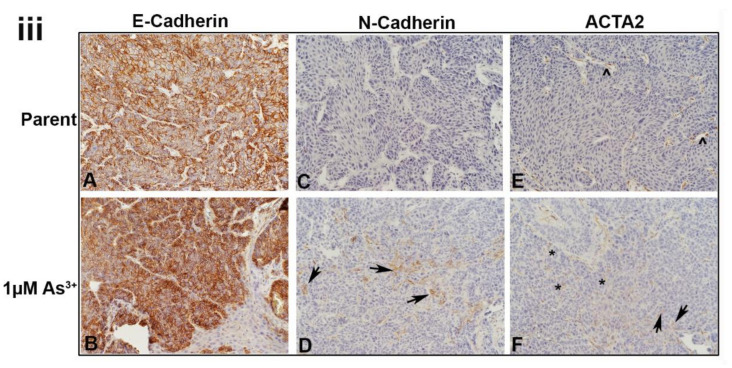
Figure 6.
Immunohistochemical staining of luminal, basal and EMT markers within the tumors formed from parent and As3+-exposed RT4 cells. (iA,iB). Nuclear PPARγ expression in the tumors produced by the parent and As3+-exposed cells, PPARγ was expressed in the majority of cells in the parent and weaker in the 1 µM As3+-treated cells. (iC,iD). Nuclear FOXA1 expression, there was a greater proportion of staining of FOXA1 in the tumors generated from the 1 µM As3+-exposed cells compared to the parent. (iE,iF). Nuclear expression of GATA3, having greater staining within the tumors generated from cells exposed to 1 µM As3+ compared to the tumors formed by the parent RT4 cells. (iiA,iiB). Membrane staining of EGFR in tumors produced by the parent and As3+-treated cells. EGFR expression was higher in the tumors produced from 1 µM As3+ treatment compared to the parent. (iiC,iiD). Nuclear staining of TFAP2A, having greater expression in tumors produced from 1 µM As3+ treatment compared to the parent. (iiE,iiF). Nuclear expression of P63, showing greater staining in tumors produced from 1 µM As3+ treatment compared to the parent. (iiiA,iiiB). Membrane expression of E-Cadherin (CDH1) in tumors produced by the parent (iiiA) and As3+-treated cells (iiiB), the staining was strong in all the tumors. (iiiC,iiiD). Membrane staining of N-Cadherin (CDH2), the parent displayed no expression but there was focal staining in the As3+-exposed tumors with a few cells expressing the protein localized to the cell membrane (black arrows). (iiiE,iiiF). Staining for ACTA2, in the parent expression was mainly in the cells of the blood vessels and connective tissue (iiiE). In the tumors formed by the As3+-exposed cells (iiiF), there were more blood vessels which stained for ACTA2 and there was also an increase in staining in the connective tissue cells. A few dispersed tumor cells also showed staining for the protein (iiiF). The black arrows point to tumor cells, the caret (^) indicates blood vessels, and the asterisks (*) point out the stroma/connective tissue. The brown color indicates the presence of the protein whereas the blue/purple color indicates the nuclei that are stained with the counterstain hematoxylin. All images are at a magnification of 200×.


