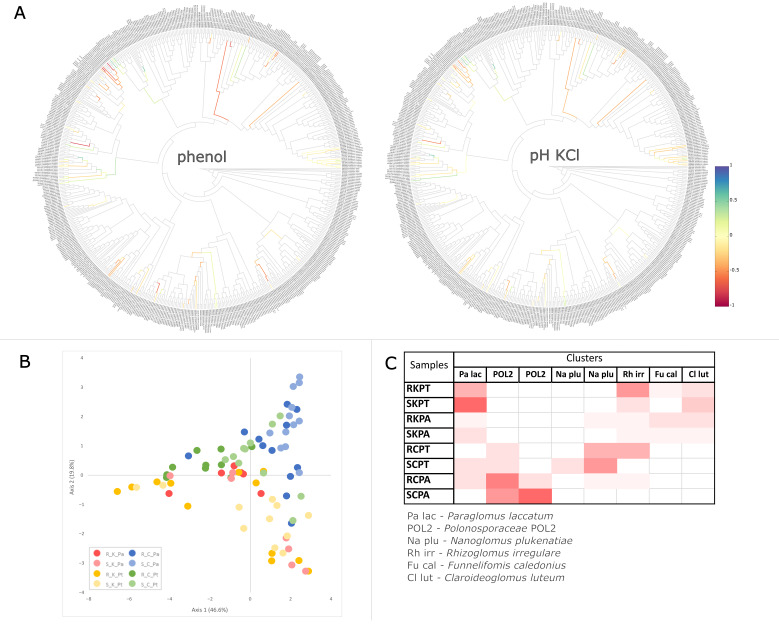
Figure 4.
Exemplary trees visualizing Spearman’s correlation coefficient between phenol contamination and soil pHKCl and edge masses. Blue and red colors indicate positive and negative correlation of placements with the phenol and pHKCl, respectively (A). Correlation trees for the other physicochemical factors (PAHs, soil moisture, SOM, Ntot, pHwater) are shown in Figure S7. Edge PCA demonstrating the spatial distribution of the soil (S) and root (R) AMF communities associated with P. trivialis (Pt) and Ph. australis (Pa) collected from the contaminated (K) and uncontaminated (C) sites based on the differences in placements across the edges of the phylogenetic tree (B). A heat-map summarizing the results of imbalance k-means clustering. Color intensity is proportional to the number of samples representing the root (R) and soil (S) AMF communities associated with P. trivialis (PT) and Ph. australis (PA) at the contaminated (K) and the uncontaminated site (C) that are assigned to clusters represented by the AMF species of the highest Euclidean distance of the edge imbalance between samples (C).

