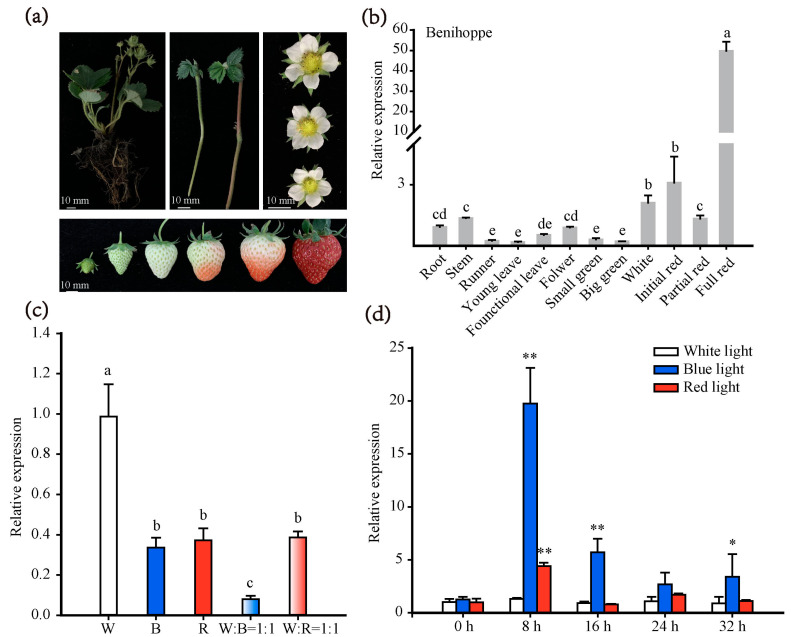
Figure 2.
Expression characteristics of FaWRKY71. (a) Diagrams about different tissues of ‘Benihoppe’. Scale bars represent 10 mm. (b) Spatial and temporal expression of FaWRKY71 in different tissues and different developmental stages of strawberries. Multiple comparisons were tested using Turkey’s test and significant differences (p < 0.05) were indicated by different lowercase letters. (c) Effects of different light qualities on FaWRKY71 gene expression in strawberry full red fruits. W (White light); B (Blue light); W: B = 1:1 (White light: Blue light = 1:1); W: R = 1:1 (White light: Blue light = 1:1). (d) Effects of different light qualities on FaWRKY71 gene expression in tissue culture seedlings of strawberry. Error bars were SEs for three replicates, and statistical significance was determined with the white light by Student’s t-test (**, p < 0.01; *, p < 0.05).

