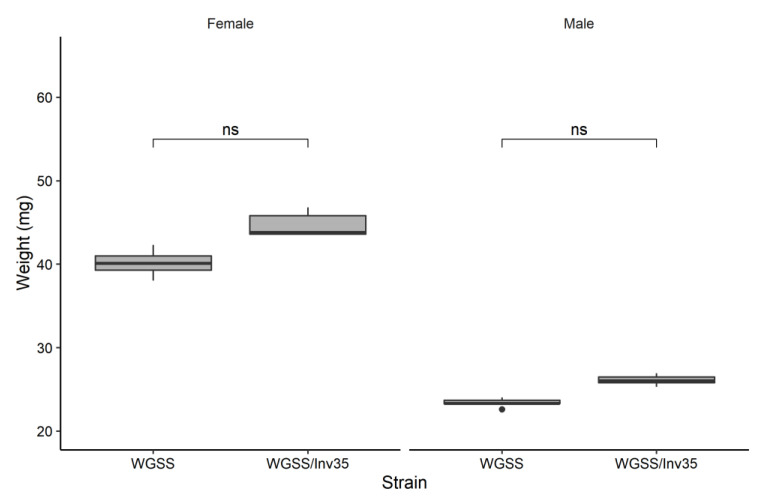
Figure 6.
Weight per 10 male and female pupae of WGSS and WGSS/Inv35 strains. Three replicates were performed per sex per strain. Statistical analysis was carried out using a GLM with Poisson distribution. The whiskers indicate the variability outside the upper and lower quartiles (represented as the upper and lower boxes, respectively). The thick horizontal line represents the median, and the dot indicates a possible outlier. Significance symbol: ‘ns’ for ‘not significant’.

