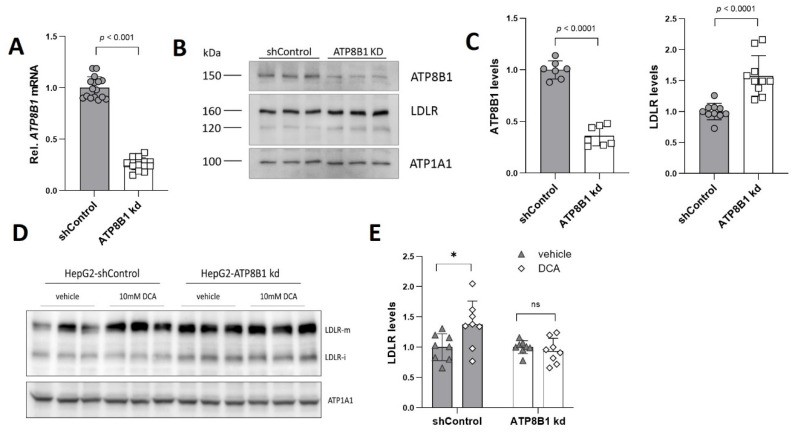
Figure 1.
ATP8B1 knockdown coincides with increased LDLR expression. (A) ATP8B1 mRNA expression in ATP8B1 knockdown HepG2 cells. Data were normalized to shControl cells and are expressed as means +/− s.e.m. of 16 replicates from 5 independent experiments. Statistical analysis by an unpaired t-test.; (B) LDLR protein levels are increased in ATP8B1 kd HepG2 cells. Western blot of total cell lysates from a representative experiment is shown. ATP1A1 is included as a transfer control; (C) Densitometric analysis of ATP8B1 and LDLR levels. Data are expressed as relative mean protein levels normalized to ATP1A1 ± standard deviation of 7–10 replicates from 2–3 independent experiments. Statistical analysis by an unpaired t-test; (D) Representative Western blot of total cell lysates showing the effect of DCA (10 mM, 48 h) on LDLR levels. LDLR-m, mature form of LDLR; LDLR-I, immature form of LDLR; (E) Quantification of LDLR protein levels after DCA challenge. Data were normalized to the vehicle control of each cell line and are expressed as means +/− s.d. of 8 replicates from 3 independent experiments. Statistical analysis by a multiple paired t-test; * p < 0.05; ns, not significant.

