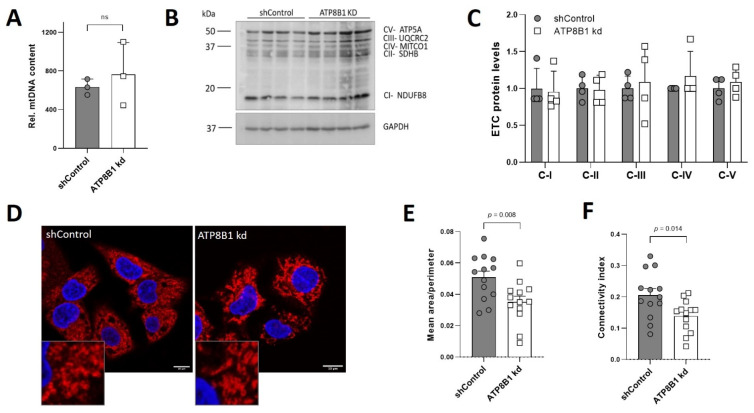
Figure 4.
No change in mitochondrial mass and increased mitochondrial fragmentation in ATP8B1 knockdown cells. (A) Genomic LC-PCR analysis of the mtDNA NADH-ubiquinone oxidoreductase chain 1. Data are expressed as mean +/− s.d. of 3 independent DNA isolations. Statistical analysis by an unpaired t-test; ns, not significant; (B) Western blot analysis from total cell lysates of electron transport chain complex (ETC) I-V protein markers; (C) Densitometric analysis of ETC protein levels. Data were corrected for GAPDH, normalized to shControl cells and expressed as means +/− s.d. of 4 independent experiments. No statistical significance by multiple unpaired t-test; (D) Confocal analysis of TOM20 staining in red and nuclear dapi in blue. Bar = 10 nm; (E,F) Quantification of mitochondrial fragmentation. HepG2 cells were stained for TOM20 and the mitochondrial network was quantified as described in the materials and methods. Ratio of mean mitochondrial area over perimeter (E) and mitochondrial connectivity (F), representing average mitochondrial area/perimeter ratio normalized to circularity to account for mitochondrial swelling, are shown. Data are expressed mean values +/− s.e.m. of 13 images (3–4 cells/image) from 3 independent experiments. Statistical analysis by an unpaired t-test.

