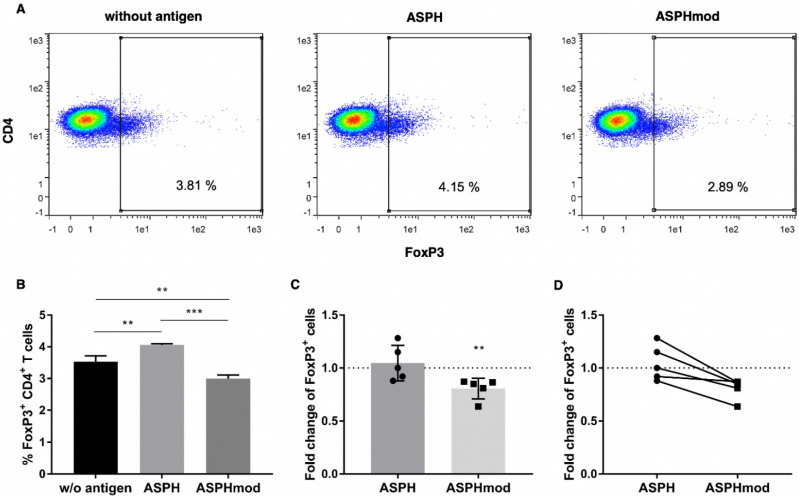
Figure 7.
ASPHmod-pulsed moDCs induce fewer Treg cells. (A) Representative flow cytometric analysis of a single individual. (B) Number of CD4+FoxP3+ T cells after restimulation with no antigen-, ASPH- or ASPHmod-pulsed DCs. Data represent the mean ± SD of a single individual donor assessed in triplicate: ** significantly different, p < 0.01, *** significantly different, p < 0.005 (one-way ANOVA). (C) Fold change in CD4+FoxP3+ T cells relative to cells restimulated with the non-pulsed moDC control. Data represent the means ± SD of five individuals: ** significantly less, p < 0.01 (Mann–Whitney test). (D) Relative T cell response of nine individuals to ASPH- versus ASPHmod-pulsed moDCs.

