Figure 1.
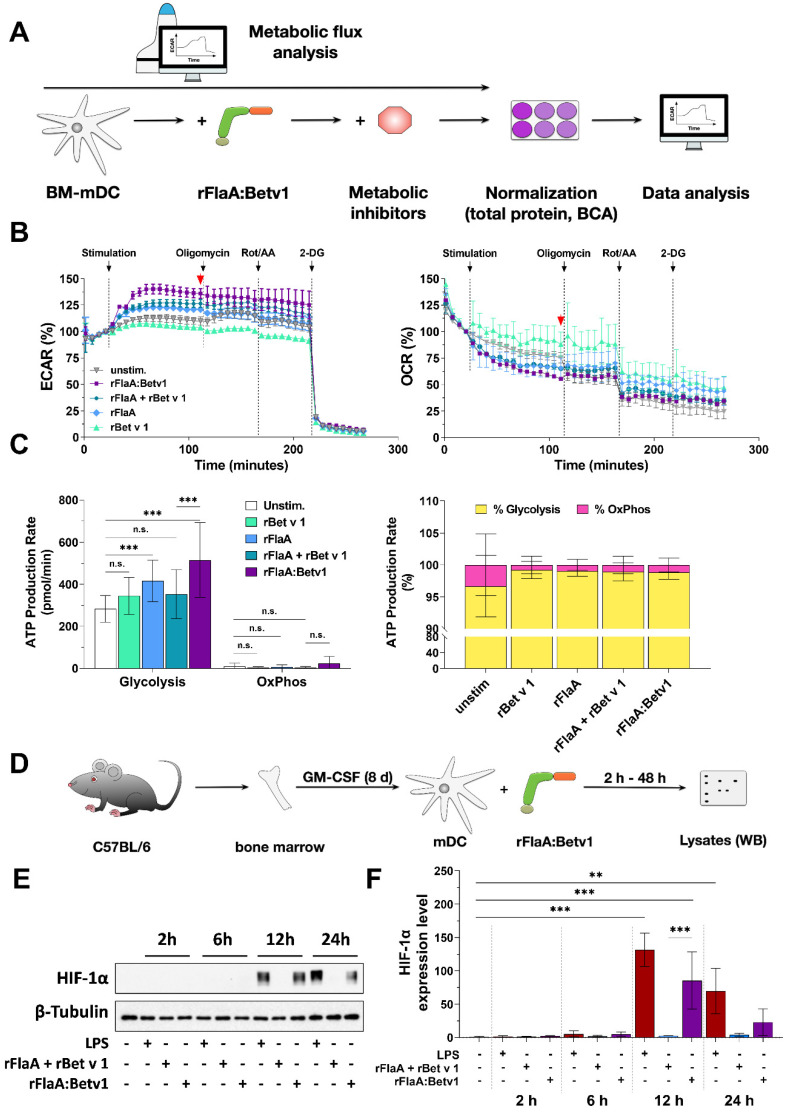
rFlaA:Betv1 induces a pronounced switch towards glycolysis in stimulated mDCs. C57Bl/6J mDCs were stimulated with equimolar concentrations of either rFlaA + rBet v 1 or rFlaA:Betv1 (equimolar to 4 µg/mL of rBet v 1) or 100 ng/mL LPS as a positive control and analyzed for extracellular acidification rates (ECAR) and oxygen consumption rates (OCR) using Seahorse technology (A). 14 cycles (84 min) post-stimulation, ATP synthase, the electron transport chain, and glycolysis were inhibited by sequential injection of oligomycin, rotenone/antimycin A (Rot/AA), and 2-deoxy-glucose (2-DG), for eight cycles (48 min) each, respectively. The red arrow indicates the time point used for statistical analyses in Repos. Figure S3 (for more information, see text) (B). Levels of glycolytic- and mitochondrial ATP-production, glycolysis, and oxidative phosphorylation (OxPhos) were analyzed by metabolic flux assay using the “ATP rate assay” according to the manufacturer’s recommendations (C). For HIF-1α detection, mDCs were stimulated with either 10 µg/mL of LPS, 17.4 µg/mL of rFlaA + 10 µg/mL rBet v 1, or 27.4 µg/mL rFlaA:Betv1 for the indicated time points and analyzed via Western Blot (D,E). Expression levels were first normalized to the β-tubulin loading control, followed by normalization to unstimulated controls (F). Data are either representative results of three independent experiments that showed similar results (B,C,E) or results of three independent experiments (F). Statistical comparisons were performed by 2-way ANOVA with correction for multiple comparisons according to Turkey and indicated as: n.s. p-value > 0.05, ** p-value < 0.01, *** p-value < 0.001.

