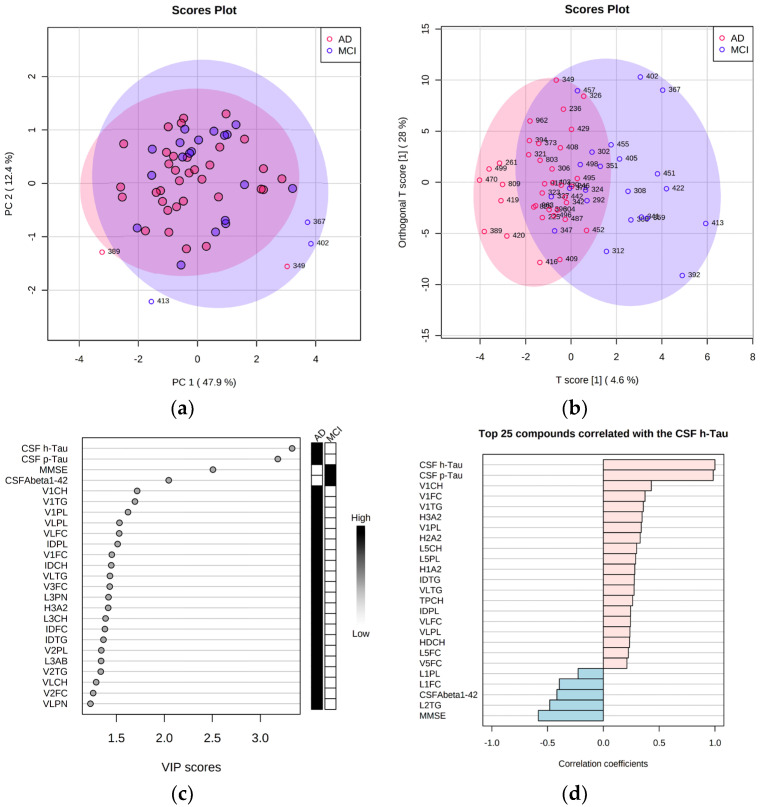
Figure 2.
Multivariate analysis of 2−group lipoprotein and metadata comparison plotted via PCA scores plot (Panel (a), outliers shown), via the oPLS−DA regression model analysis scores plot (Panel (b)). Additionally, the top 25 data entries were plotted according to their variable importance (VIP) score based on the oPLS−DA regression model analysis ranked by T score (Panel (c)). Finally, a comparison of the top 25 Spearman correlations was performed in the context of CSF h−tau biomarker levels and visualized via a PatternSearch plot for a group of patients (n = 17) who showed the most apparent changes in the T score (Panel (d)).

