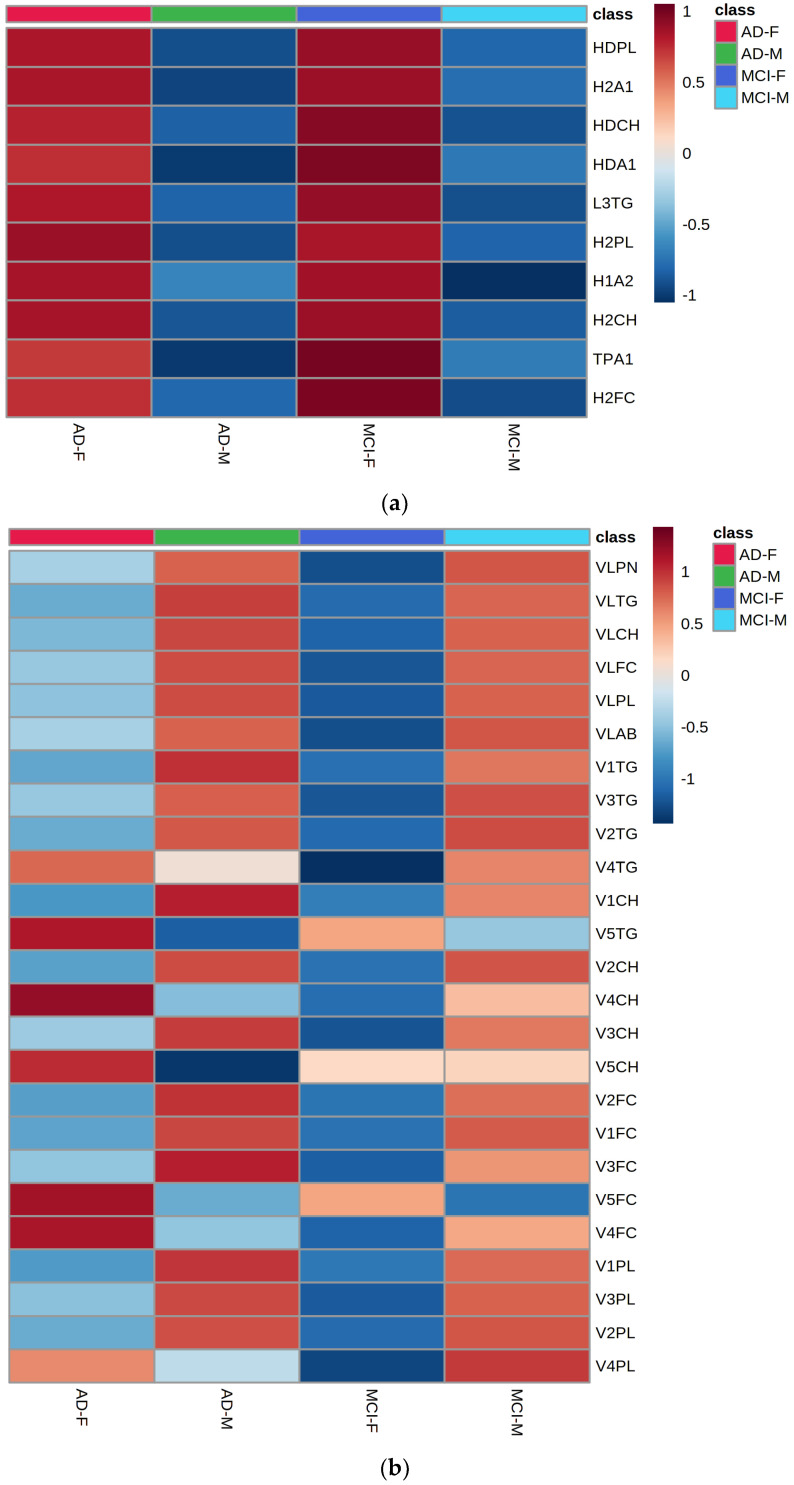
Figure A3.
Heatmap plot analysis based on male−female comparisons within patient groups (AD, Con, and MCI) for the dataset from the whole cohort lipoprotein data and a selection of the top−10 features for females (Panel (a)) alongside illustration of the VLDL parameters that were high in male groups (Panel (b)).

