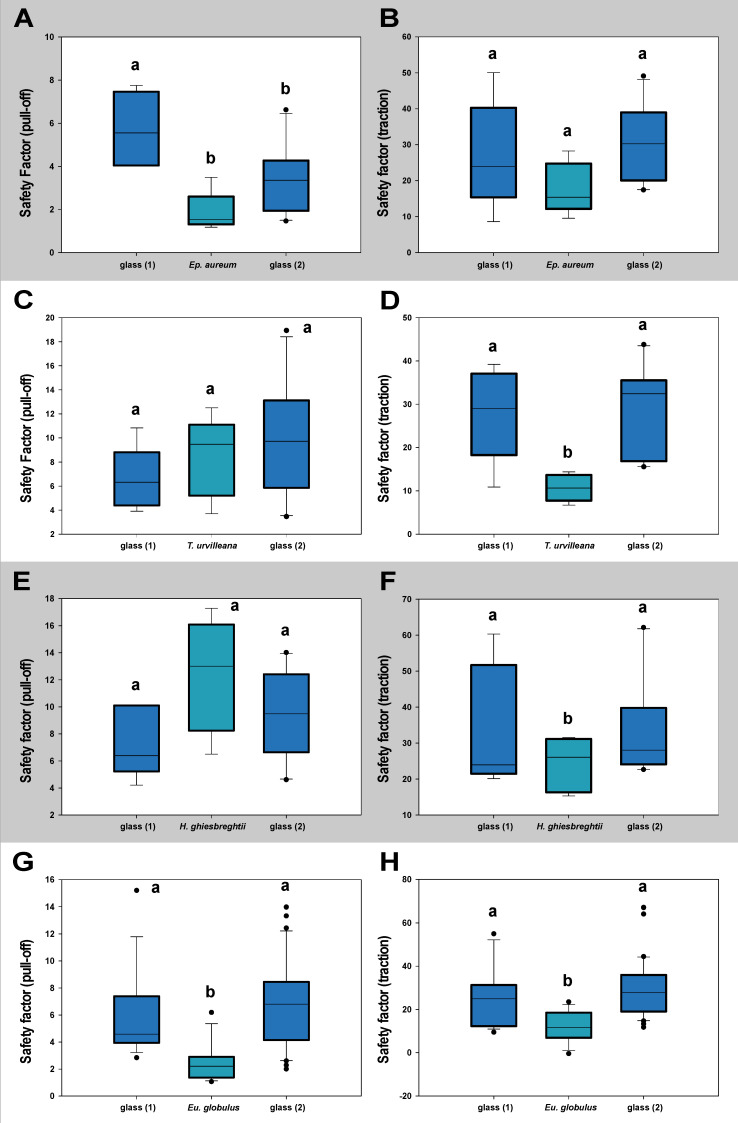
Figure 6.
Contamination effect of the leaf substrates tested with M. extradentata shown through safety factor. (A) Ep. aureum, pull-off force. (B) Ep. aureum, traction force. (C) T. urvilleana, pull-off force. (D) T. urvilleana traction force. (E) H. ghiesbreghtii, pull-off force. (F) H. ghiesbreghtii, traction force. (G) Eu. globulus, pull-off force. (H) Eu. globulus, traction force. Statistically similar groups within a graph are marked with the same lowercase letter, tested through (A): one-way ANOVA (F = 8.453, d.f. = 2, Nglass1,Ep.aureum = 5, Nglass2 = 10, p = 0.003) Holm–Šídák method (p < 0.05); (B): one-way ANOVA (F = 2.215, d.f. = 2, Nglass1,Ep.aureum = 5, Nglass2 = 10, p = 0.140); (C): one-way ANOVA (F = 1.062, d.f. = 2, Nglass1,T.urvilleana = 5, Nglass2 = 10, p = 0.368); (D): one-way ANOVA (F = 7.722, d.f. = 2, Nglass1,T.urvillena = 5, Nglass2 = 10, p = 0.004), Holm–Šídák method (p < 0.05); (E): one-way ANOVA (F = 2.761, d.f. = 2, Nglass1,H.ghiesbreghtii = 5, Nglass2 = 10, p = 0.092); (F): Kruskal–Wallis one-way ANOVA on ranks (H = 1.054, d.f. = 2, Nglass1,H.ghiesbreghtii = 5, Nglass2 = 10, p = 0.590); (G): Kruskal–Wallis one-way ANOVA on ranks (H = 21.674, d.f. = 2, Nglass1,Eu.globulus = 15, Nglass2 = 30, p ≤ 0.001), Dunn’s method (p < 0.05); (H): Kruskal–Wallis one-way ANOVA on ranks (H = 21.001, d.f. = 2, Nglass1,Eu.globulus = 15, Nglass2 = 30, p ≤ 0.001), Dunn’s method (p < 0.05). The boxes indicate 25th and 75th percentiles, whiskers define the 10th and 90th percentiles and the line within the boxes represents the median. Outliers are shown as individual points.

