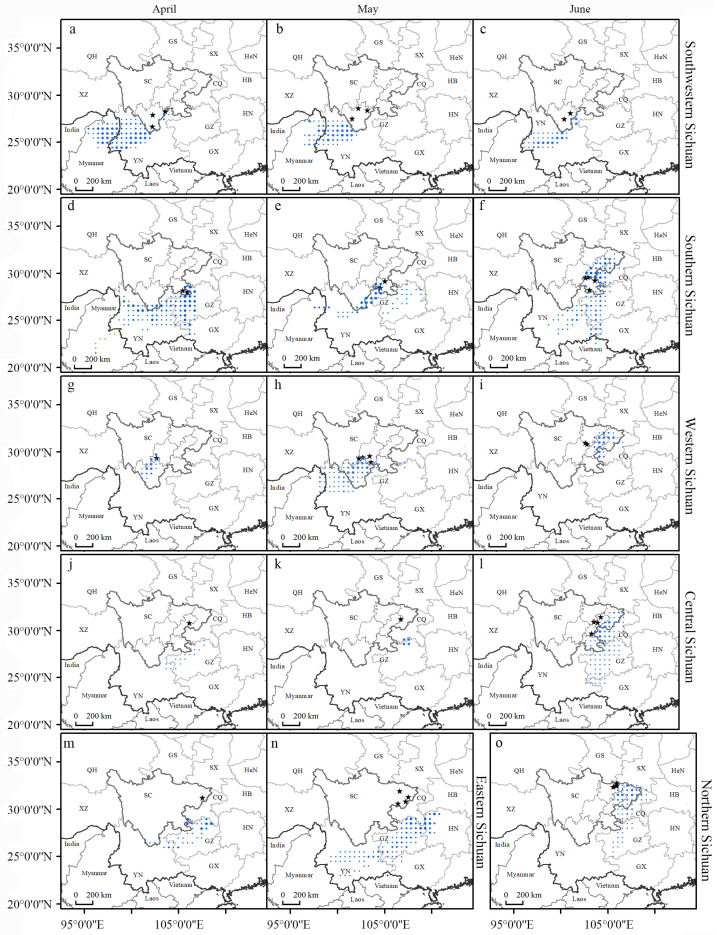
Figure 3.
Distribution of endpoints for the FAW backward migration trajectories of the different regions of Sichuan Province from April to June. The black pentagrams are the starting points of the backward trajectories of each region. The region is labeled on the left of the panel, while the time periods of trajectories are labeled on the top. The distribution of dots indicates the distribution of source areas of FAW. The larger the dots are, the greater the distribution probability. The two-letter codes refer to the different provinces of China (SC: Sichuan Province, YN: Yunnan Province, GX: Guangxi Zhuang Autonomous Region, GZ: Guizhou Province, CQ: Municipality of Chongqing, HN: Hunan Province, HB: Hubei Province, HeN: Henan Province, SX: Shaanxi Province, GS: Gansu Province, XZ: Tibet Autonomous Region, QH: Qinghai Province). (a–c), Distribution of trajectory endpoints in southwestern Sichuan in April, May and June, respectively; (d–f), Distribution of trajectory endpoints in southern Sichuan in April, May and June, respectively; (g–i), Distribution of trajectory endpoints in western Sichuan in April, May and June, respectively; (j–l), Distribution of trajectory endpoints in central Sichuan in April, May and June, respectively; (m–n), Distribution of trajectory endpoints in eastern Sichuan in April and May; (o), Distribution of trajectory endpoints in northern Sichuan in June.

