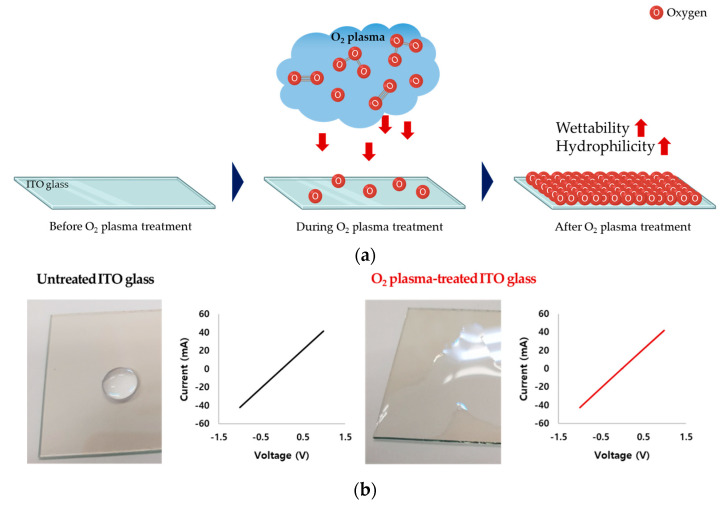
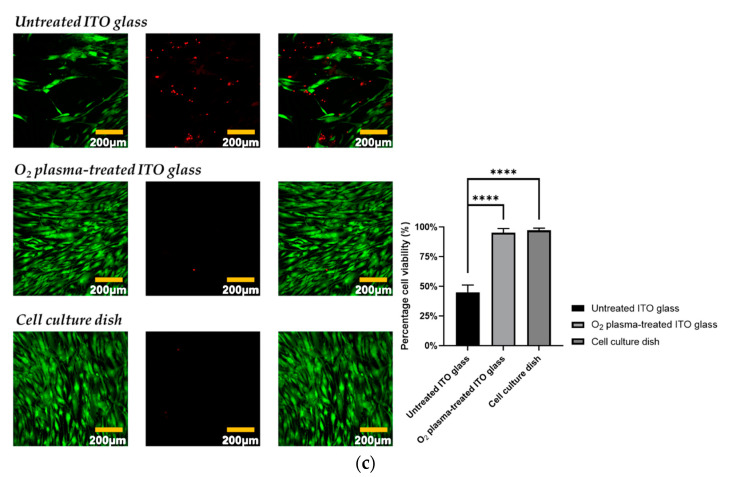
Figure 1.
(a) Schematic of the O2 plasma treatment process for wettability and hydrophilicity of O2 glass surface. (b) Untreated ITO glass and O2 plasma-treated ITO glass conductivity test. (c) hADMSC cytotoxicity test on untreated ITO glass, O2 plasma-treated ITO glass, and a standard cell culture dish (green fluorescence—live cells, red fluorescence—dead cells)/a percentage of cell viability graph data were analyzed with one-way ANOVA and Tukey’s HSD post-hoc test (error bars represent the standard deviation (SD), **** p < 0.0001).


