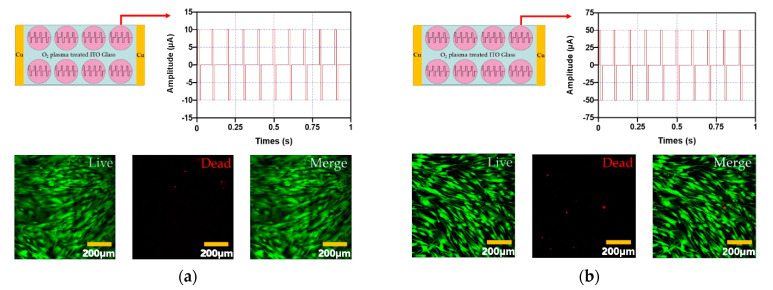
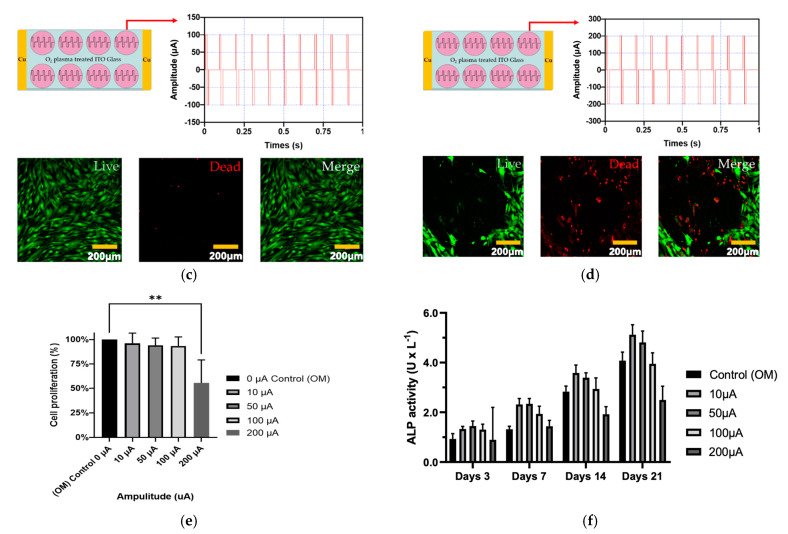
Figure 3.
The cytotoxicity of electrical stimulation hADMSCs evaluated with the four different amplitude conditions (amplitude: (a) 10 µA, (b) 50 µA, (c) 100 µA, and (d) 200 µA and the frequency of all conditions was 10 Hz). In addition, the green fluorescence represents live cells and red fluorescence represents dead cells. (e) Cell proliferation of hADMSCs with electrical stimulation, (f) ALP activity assay of hADMSCs with electrical stimulation. These graph data were analyzed with one-way ANOVA (error bars represent the standard deviation (SD, ** p < 0.01). Finally, graph (e) was performed with Tukey’s HSD post-hoc test.


