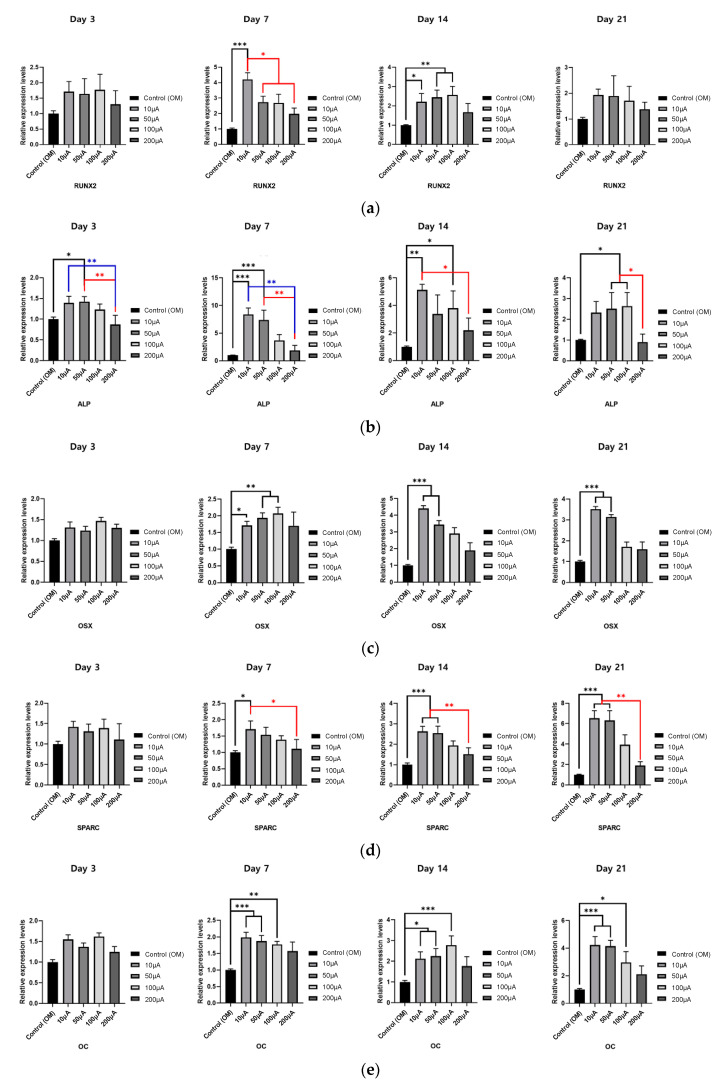
Figure 5.
(a–e) The expression of five osteogenesis-related genes (RUNX2, ALP, OSX, SPARC, OC) in cells grown on O2 plasma-treated ITO glass with electrical stimulation (one-way ANOVA, Tukey’s HSD post-hoc test was performed, and error bars represent the standard deviation (SD), * p < 0.05, ** p < 0.01, *** p < 0.001). In all graphs, different line colors (red, blue, black lines) were used to show clear differences.

