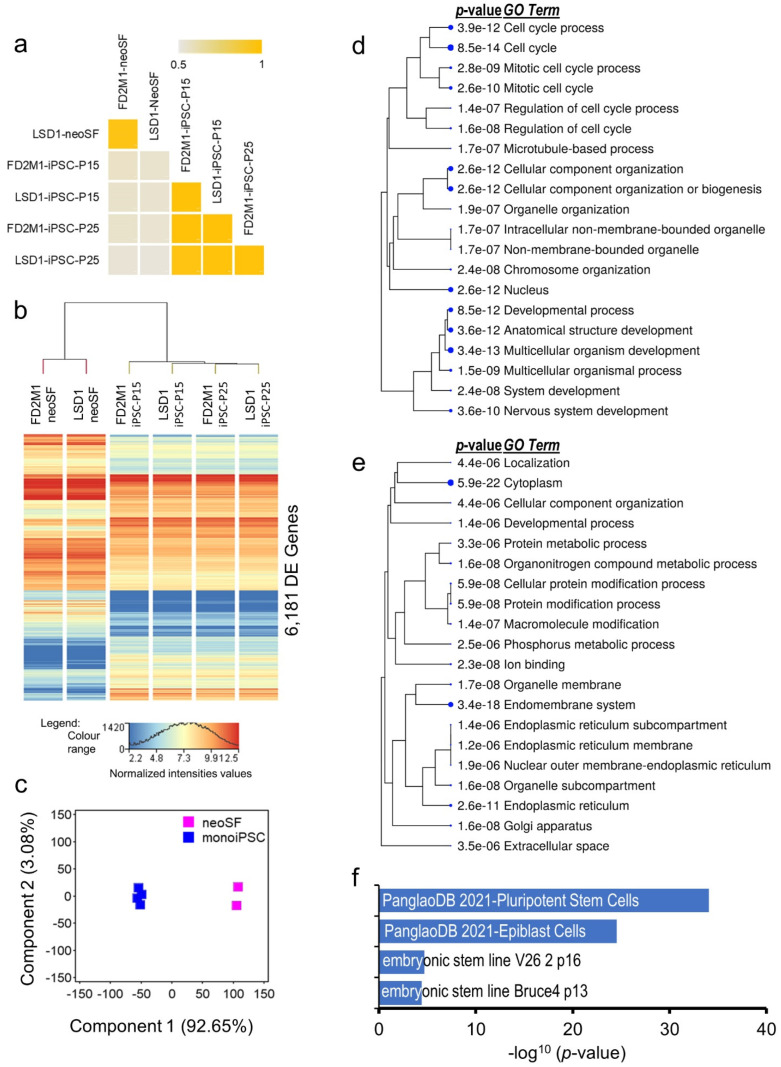
Figure 2.
monoiPSCs exhibit a large but highly uniform resetting of cellular transcriptome to pluripotency. (a) Correlation (r2) plot of established neoSF and monoiPSC lines calculated based on their expressed transcriptome (13,599 genes having NRC ≤ 20 in neoSF and/or monoiPSCs). (b) Hierarchical clustering and heatmap of neoSF and their monoiPSC lines differentially expressed (DE) transcriptome (6181 genes). (c) Principal component analysis (PCA) of DE genes between neoSF and their monoiPSC lines. (d) Hierarchical clustering of the top 20 biological processes (GO terms) that were significantly enriched in monoiPSC significantly upregulated transcriptomes. (e) Hierarchical clustering of the top 20 biological processes (GO terms) that were significantly enriched in the neoSF transcriptome that was significantly downregulated in monoiPSCs. Both d and e gene ontology (GO) enrichment analyses were performed using ShinyGO v.0.75 web tool. GO terms are clustered based on shared genes; larger dot size indicates higher significance. (f) Bar plot showing highly significant enrichment of monoiPSC-upregulated transcriptome in PanglaoDB database [27] gene set for pluripotent stem cells and epiblast cells, and in mouse gene atlas of embryonic stem cell lines -V26 2p16 and -Bruce4 p13 9.

