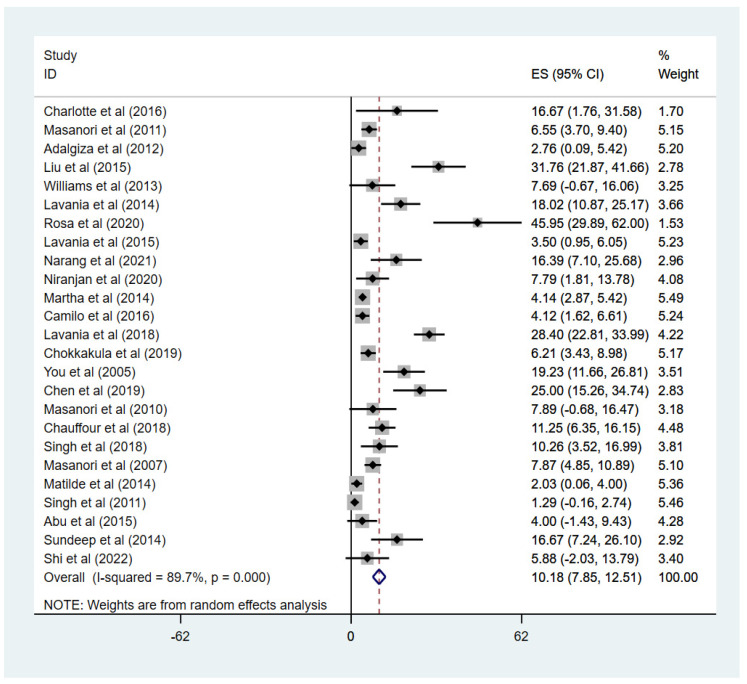
Figure 4.
The forest plot of drug−resistance rates in Mycobacterium leprae. ES = drug−resistance rate, 95% CI = confidence interval. The incidence and 95% CI of the drug−resistance rate for each study are represented. Forest plot of drug−resistance rates of Mycobacterium leprae isolates in studies meeting inclusion criteria (n = 25) [14,19,20,21,22,23,24,25,26,27,28,29,30,31,32,33,34,35,36,37,38,39,40,41,42].

