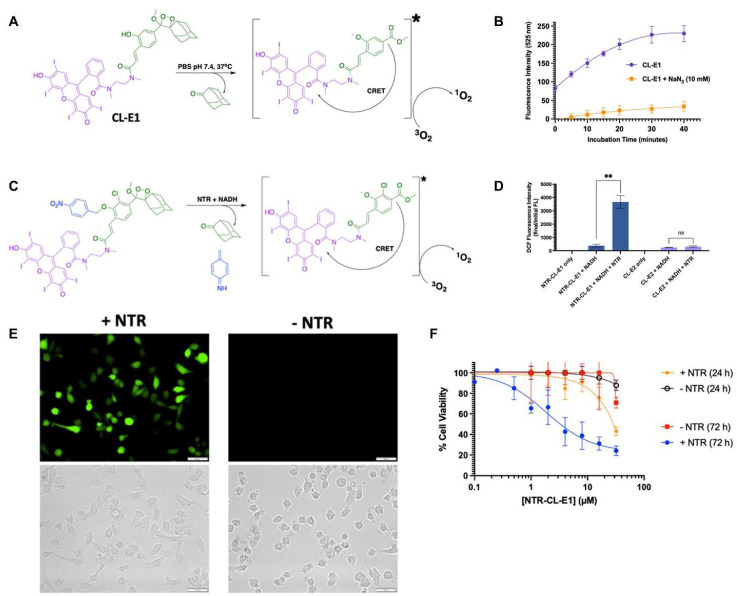
Figure 4.
(A) Schematic illustration of 1O2 generation principle by CL-E1. (B) The ROS generation of CL-E1 by monitoring the fluorescence of 2′,7′-dichlorofluorescin in the absence (purple line) or presence (orange line) of sodium azide (a specific scavenger of 1O2). (C) Schematic illustration of 1O2 generation principle by NTR-CL-E1. (D) NTR-CL-E1 (blue) production of ROS (blue) after overnight incubation in the presence or absence of NTR. **: p < 0.01; ns: no significance. (E) ROS imaging of NTR-CL-E1 in MDA-MB231 cells +/− NTR expression (green fluorescence from 2′,7′-dichlorofluorescin). scale bar = 50 μm. (F) Cell viability of NTR-CL-E1 versus MDA-MB231 cells (+/− NTR-expressing) after 24 and 72 h of incubation. Reprinted with permission from Ref [34] Copyright 2022 American Chemical Society, New York, NY, USA.

