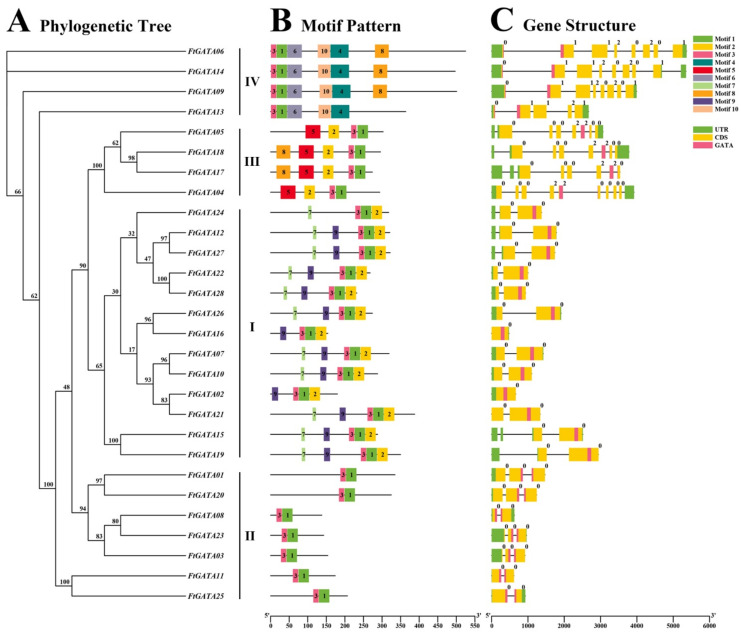
Figure 2.
Phylogenetic relationships-, motif distributions-, and gene structure of GATA genes in Fagopyrum tataricum. (A) The phylogenetic tree was constructed with 1000 replicates on each node. (B) The 1–10 amino acids motifs in FtGATAs protein are represented with ten different colored boxes, and black lines represent relative protein length. (C) The UTR (untranslated region), CDS (coding sequence), GATA domain, and introns are indicated by green squares, yellow squares, pink squares, and black lines, respectively.

