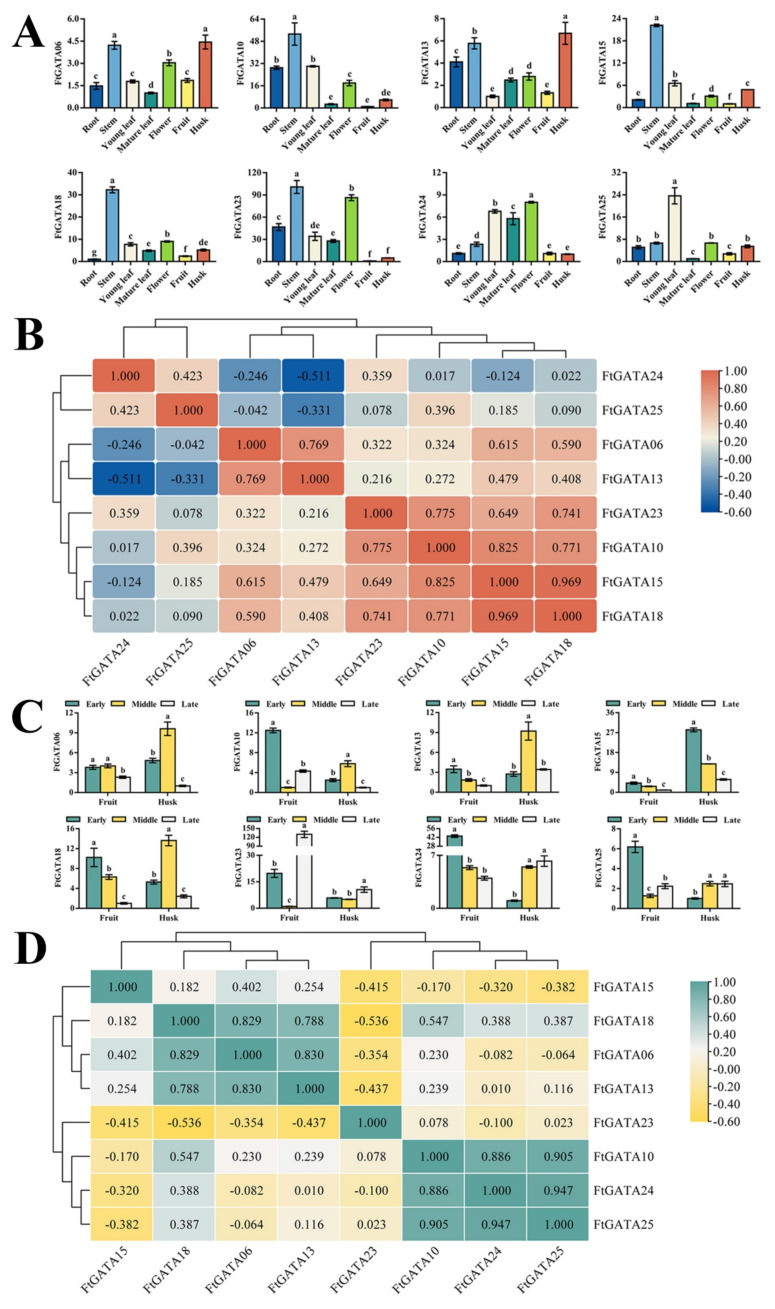
Figure 7.
Relative expression levels and correlation hierarchical cluster analysis of 8 Fagopyrum tataricum GATA genes (FtGATA06, FtGATA10, FtGATA13, FtGATA15, FtGATA18, FtGATA23, FtGATA24, and FtGATA25) in tissues and during fruit development. (A) Expression patterns of eight FtGATA genes at the mid-grain filling stage in roots, stems, young leaves, mature leaves, flowers, fruit, and husks. (B) Correlation analysis between their expression in different tissues at the mid-grain filling stage. (C) Expression patterns of eight FtGATA genes in the fruit and husk during early, middle, and late grain-filling stages. (D) Correlation analysis between their expression in the fruit and husk during the grain-filling stage. Column chart values are expressed as the mean ± SD according to Duncan’s multiple comparisons; different lowercase letters represent significant differences among different treatments (p < 0.05). Positive and negative numbers in the schematic graph of correlation represent positive and negative correlation, respectively; larger values indicate stronger correlations.

