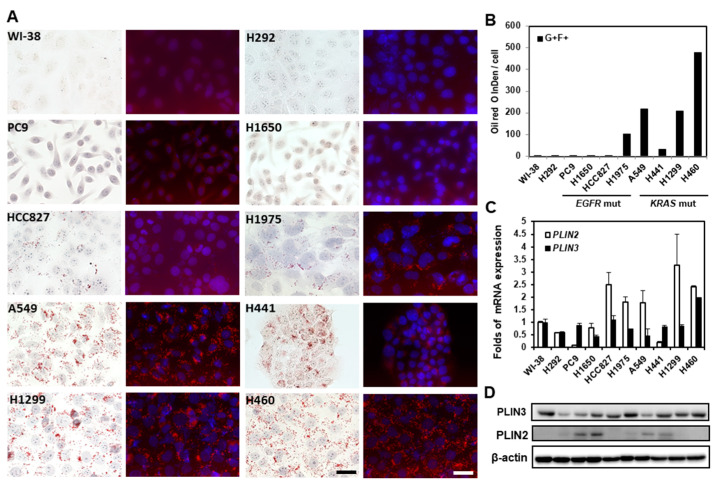
Figure 3.
Oil droplet staining in lung cancer cell lines. (A) LDs in lung cancer cells were stained by ORO and recorded using Zeiss Axio Observer inverted light fluorescence microscope with Axiocam 512 color and 512 mono digital cameras. The fluorescence color emitted by Oil Red O was captured using a rhodamine filter set (Ex: 548 nm/Em: 580 nm, labeled in red) with nuceli counterstained with DAPI (labeled in blue). Images were recorded at 400× magnification (scale bar, 50 µm) (B) The amounts of LDs were measured using ImageJ. The fluorescence intensities of Oil Red O were integrated (IntDen value). The mRNA (C) and protein (D) expressions of PLIN2 and PLIN3 in the 10 cells were measured using real-time quantitative PCR and immunoblot analyses, respectively. The fold of mRNA expression change was calculated using 2−ΔΔCt method with β-actin as the reference gene and compared with the expression level in WI-38 cells.

