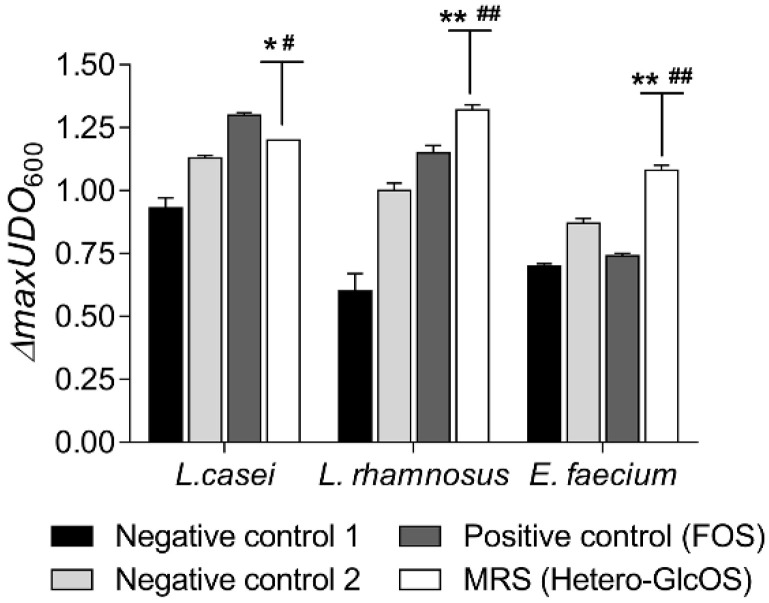
Figure 3.
Maximal variation of turbidity (ΔmaxOD600) of lactic acid bacteria cultures. Lactobacillus casei, Lactobacillus rhamnosus and Enterococcus faecium were inoculated for 24 h at 37 °C in Man-Rogosa-Sharpe (MRS) medium with: no carbon source (black bars), glucose, fructose and sucrose (grey bars), the commercial FOS mixture (dark grey bars) and the mixture of hetero-GlcOS (white bars). Error bars represent the standard deviations from three independent analysis. Differences (p < 0.05, p < 0.01) with the negative and positive controls are indicated with (*) and (#), (**) and (##), respectively.

