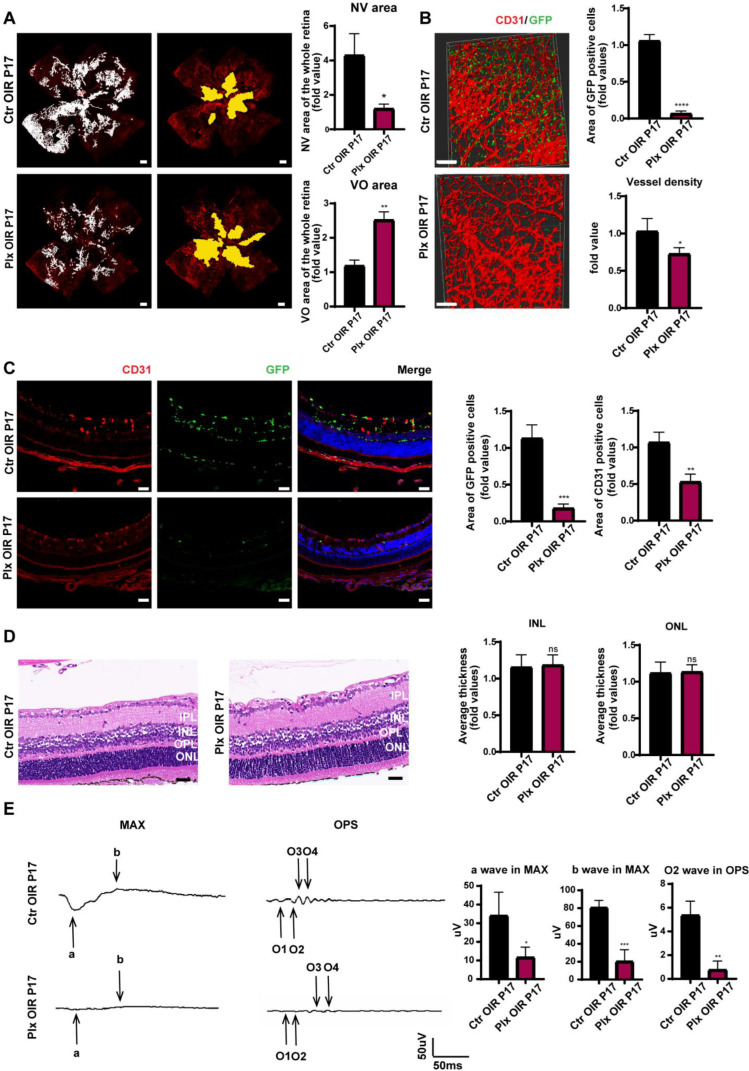
Figure 2.
Microglia depletion on P17. (A) The whole retinas of CX3CR1-GFP mice were collected on P17, and CD31 (endothelial cells) was stained with red. The white region refers to the NV area and the yellow region refers to the VO area (n = 3 per group) Scale bar, 200 µm. (B) CD31 was stained with red. Scale bar, 100 µm. (C) Immunofluorescence staining of CD31 (red) and CX3CR1 (GFP, green) in the retinas of CX3CR1-GFP mice were collected on P17 and were reconstructed by Imaris (n = 3 per group). Scale bar, 100 µm. (D) HE staining of retinas in the Ctr OIR and Plx OIR groups on P17 (n = 3 per group). Scale bar, 100 µm. (E) MAX wave and OPS wave in ERG were tested on P17 (n = 3 per group). Bars = means ± SD; * p < 0.05; ** p < 0.01; *** p < 0.001; **** p < 0.0001; NS, no significance.

