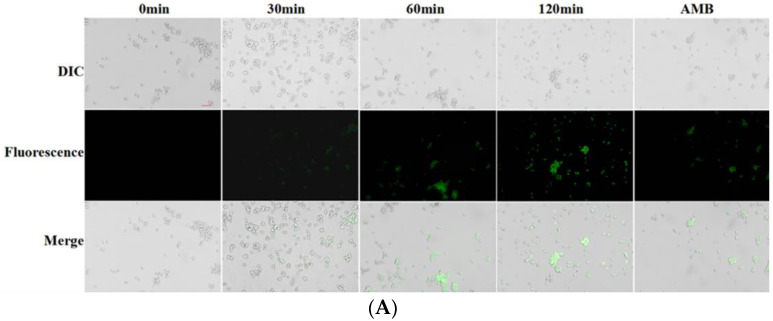
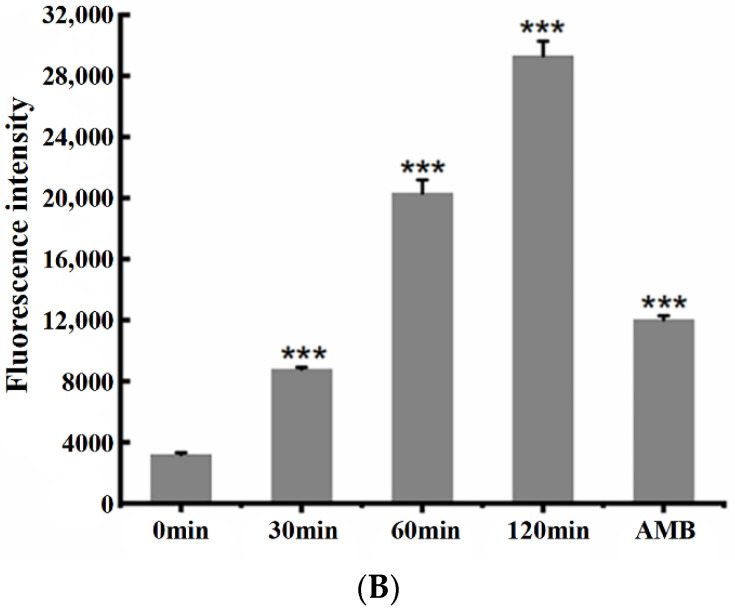
Figure 8.
The effect of Cecropin on mitochondrial membrane potential of Candida albicans. (A) Fluorescence-microscope observation of Candida albicans after DCFH-DA staining with different treatments. The scale bar represents 10 μm. (B) Fluorescence intensity was measured to indicate the mitochondrial membrane potential by multifunctional microplate reader. These values were the means of the independent triplicate replicates, showing an error bar. The Tukey test was used for the analysis-of-variance comparison; *** = p < 0.001.


