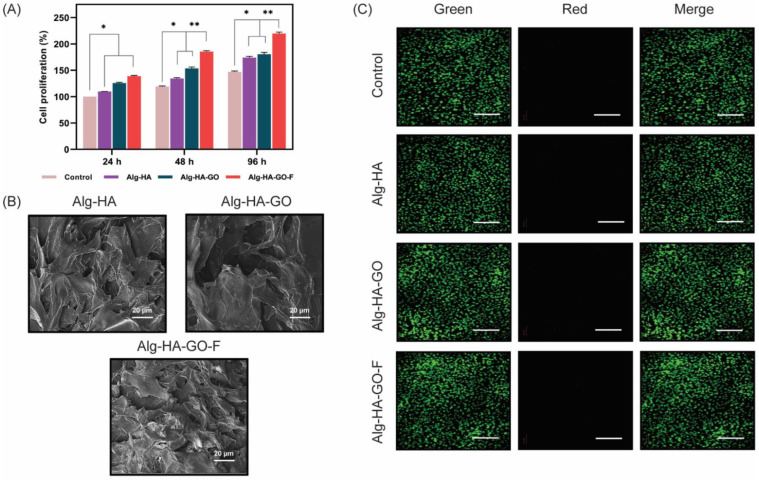
Figure 8.
(A). The cell proliferation effects of Alg-HA, Alg-HA-GO, and Alg-HA-GO-F composites at 24 and 48 h. Then, cells were harvested to calculate the percentage of cell proliferation using a trypan blue assay. Error bars and columns represent standard deviation and means. For example, here, * at p < 0.05 and ** at p < 0.01 indicate statistical difference, (B). SEM images showing the murine MSCs attachment on 3D scaffold surface after 3 days of culture, and (C). AO/EB staining for cell–scaffold construct after 2 days of culture, scale bar = 100 μm.

