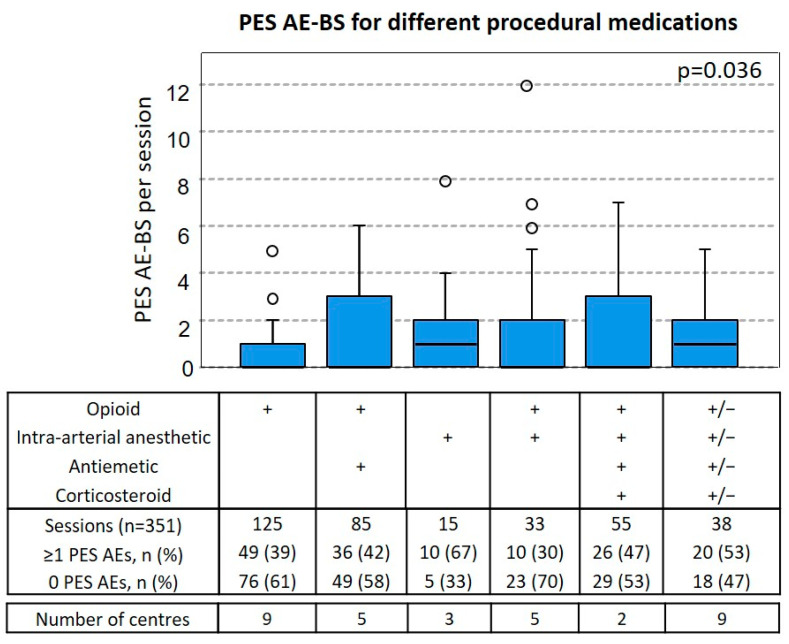
Figure 3.
AE-BS of PES after the use different procedural medications. Boxplots of PES AE-BS as the sum of all PES AE grades per patient shown for different groups of procedural medications used per session. “+” indicates the use of the respective medication, “+/−” indicates the use for some but not all sessions in that group. The number of total sessions the number of sessions with at least ≥1 PES AE (percentage per group), as well as the number of sessions with at least 0 PES AE (percentage per group) and the number of different centres per group are listed. Statistically significant differences in the medians between all groups were assessed using the Kruskal-Wallis-Test.

