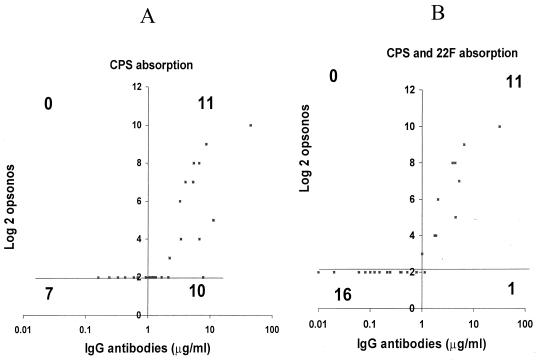
FIG. 7.
Correlation of pneumococcal type 4 ELISA and opsonophagocytosis assay titers. (A) After C PS absorption only. (B) After C PS plus type 22F PS absorption. The quadrant lines were drawn at the 1.0-μg/ml cutoff for ELISA and the log2 (1:4) cutoff for the opsonophagocytosis assay titer. The numbers shown are the number of serum samples in each quadrant. The r values were 0.66 before type 22F PS absorption and 0.92 after type 22F PS absorption.

