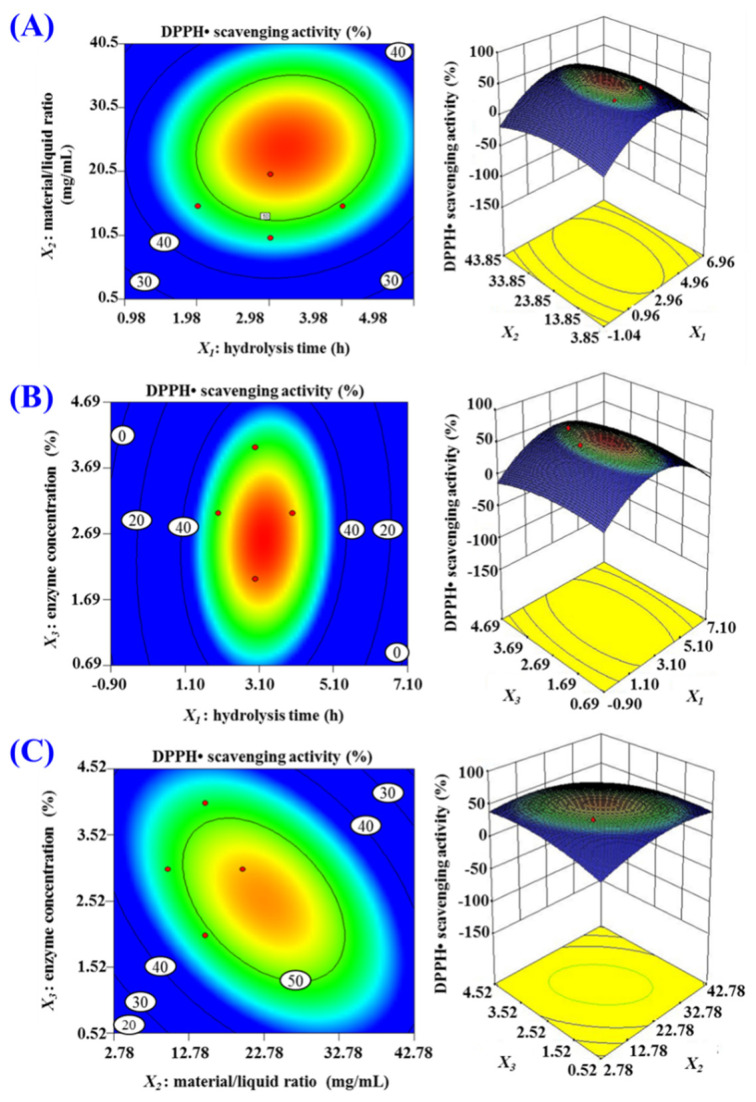
Figure 3.
Response surface graph for DPPH· scavenging activity (%) as a function of (A) hydrolysis time (X1) and material/liquid ratio (X2), (B) hydrolysis time (X1) and enzyme concentration (X3), (C) material/liquid ratio (X2) and enzyme concentration (X3) during the hydrolysis of Skipjack tuna cardiac arterial bulbs with pepsin.

