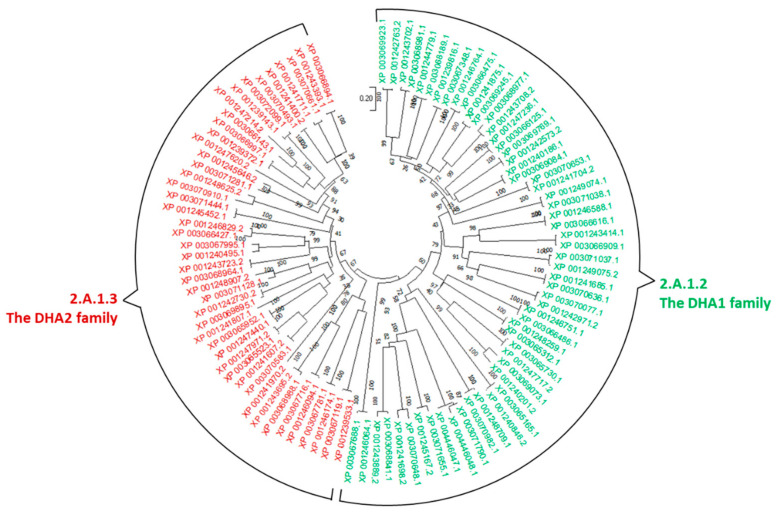
Figure 4.
Evolutionary relationships of DHA transporter families in C. immitis and C. posadasii. The sequences in the DHA1 family are marked in green, and the sequences in the DHA2 family are marked in red. The evolutionary history was inferred using the neighbor-joining method [36]. The percentage of replicate trees in which the associated taxa clustered together in the bootstrap test (1000 replicates) are shown next to the branches [39]. The tree is drawn to scale, with branch lengths in the same units as those of the evolutionary distances used to infer the phylogenetic tree. The evolutionary distances were computed using the Poisson correction method [97] and are in the units of the number of amino acid substitutions per site. Evolutionary analyses were conducted in MEGA11 [38]. Accession numbers: XP_0012XXXXX (C. immitis sequences), XP_004445935.1 (C. immitis), and XP_0030XXXXX (C. posadasii sequences).

