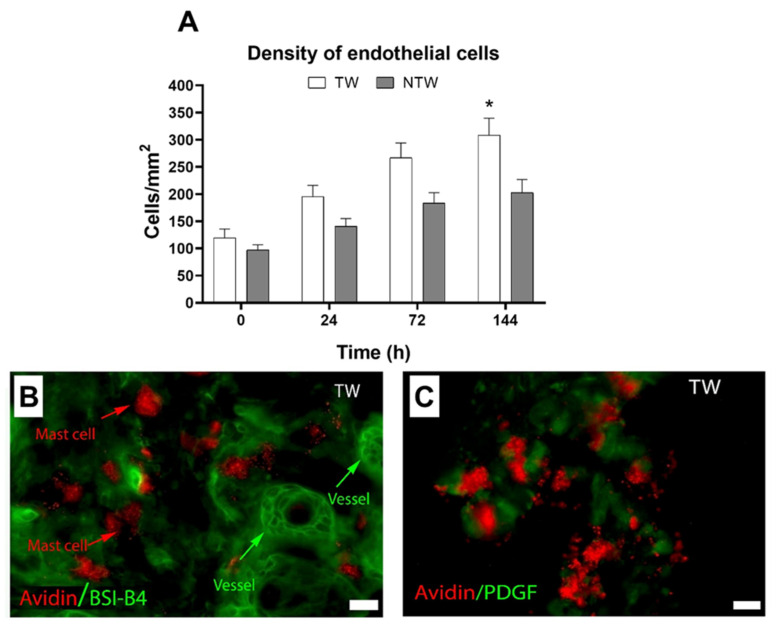
Figure 6.
Histology and immunofluorescence analyses of angiogenesis in TW or NTW groups. (A) Density of vessels in TW or NTW groups (unit of measure: number of cells for tissue-section area), p < 0.05. (B) MCs and vessels in TW group at 6 days. (C) Expression of PDGF in MC granules at 6 days of treatment. White column: TW; black column: NTW. Scale bar: 10 μm; red: avidin; green: BSI-B4 (Bandeiraea simplicifolia) (B) or PDGF (C). Data are expressed as the mean ± SD. Significant p-values: * p < 0.05 vs. NTW at the same time point.

