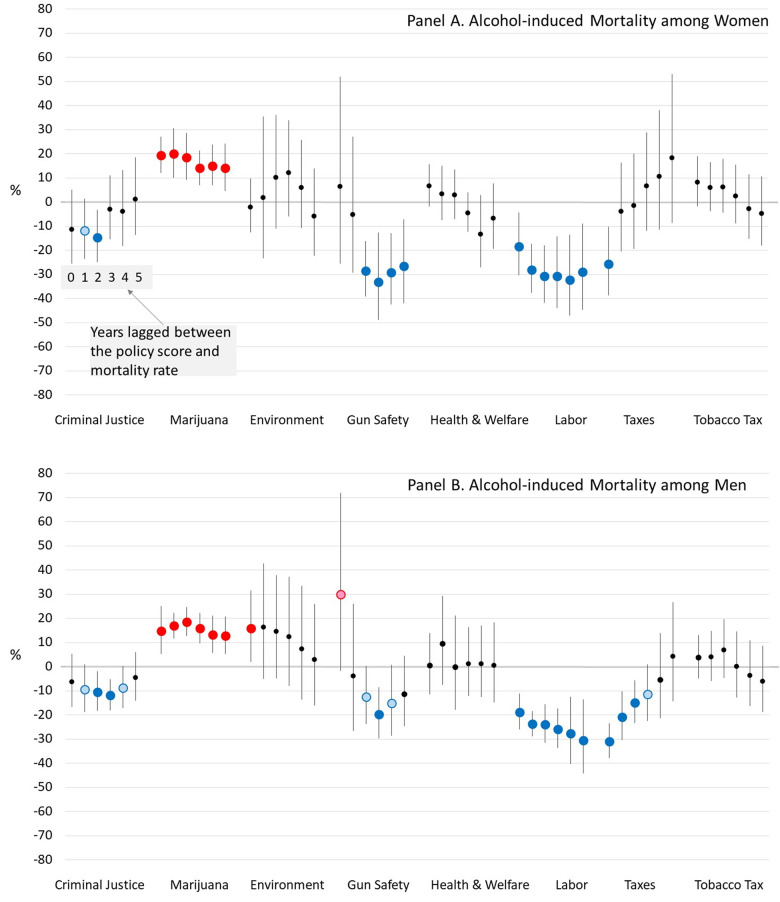
Fig 4. Estimated percent difference in alcohol-induced mortality rates when a U.S. State’s policy liberalism score is 1 versus 0, for various lag times between the policies and mortality.
Notes: Blue dots mean a more liberal version of the policy is associated with lower mortality and red dots mean a more conservative version is associated with lower mortality. Dark blue and red dots indicate that the association is significant at α<0.05, while light blue and red dots indicate that it is significant at α<0.10.

