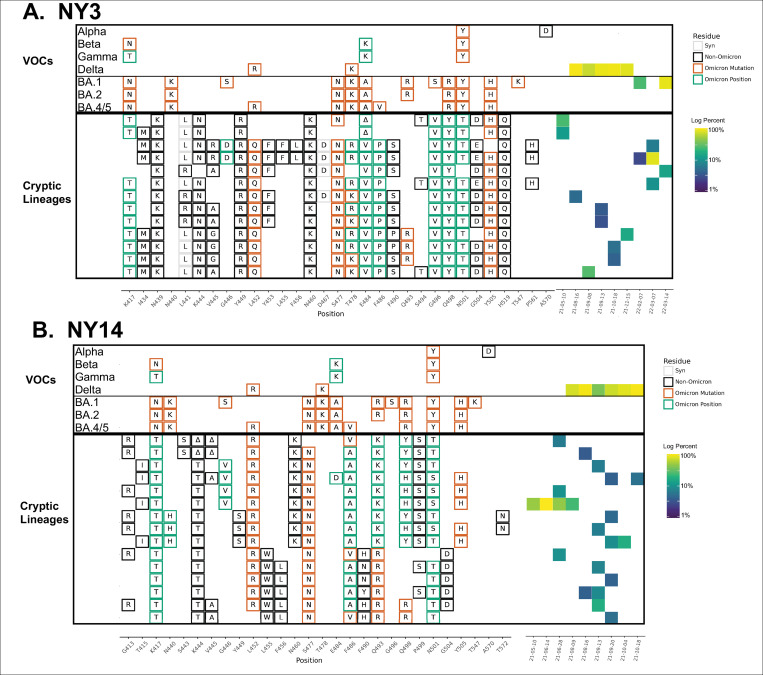
Fig 2. NY3 and NY14 RBD amplifications.
Overview of the SARS-COV-2 Spike RBD lineages identified from the A. NY3 and B. NY14 sewersheds. Amino acid changes similar to (green boxes) or identical to (orange boxes) changes in Omicron (BA.1, BA.2 or BA.5) are indicated. Synonymous changes (syn) are indicated in gray. The major US VOCs (Alpha, Beta, Gamma, BA.1, BA.2, and BA.5) are indicated. The heatmap (right) illustrates lineage (row) detection by date (column), colored by the log10 percent relative abundance of that lineage. Uncondensed output in S3 and S4 Data.

