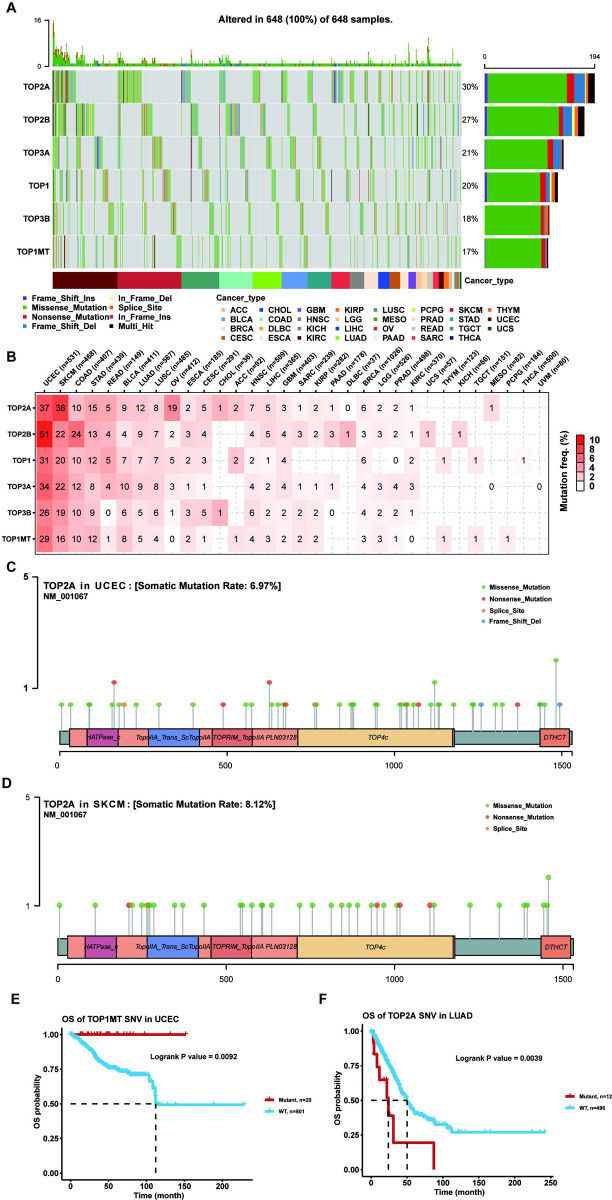
Fig 3. SNV analysis of topoisomerase family genes.
(A) The waterfall diagram showed the SNV frequency distribution of topoisomerase family genes in different types of tumors. Side barplot and top barplot show the number of variants in each gene and each sample, respectively. (B) Percentage heatmap showed the topoisomerase family genes SNV frequency in different types of cancer. Each unit of the number represents the number of samples in certain types of cancer mutations. The 0 and blank in the cell indicate there is no mutation in specific gene coding region and all regions of a specific gene, respectively. (C) Lollipop diagrams of TOP2A mutation sites, types and frequencies in UCEC. (D) Lollipop diagrams of TOP2A mutation sites, types and frequencies in SKCM. (E) Survival curve between WT and Mutant groups of TOP1MT in UCEC. (F) Survival curve between WT and Mutant groups of TOP2A in LUAD.

