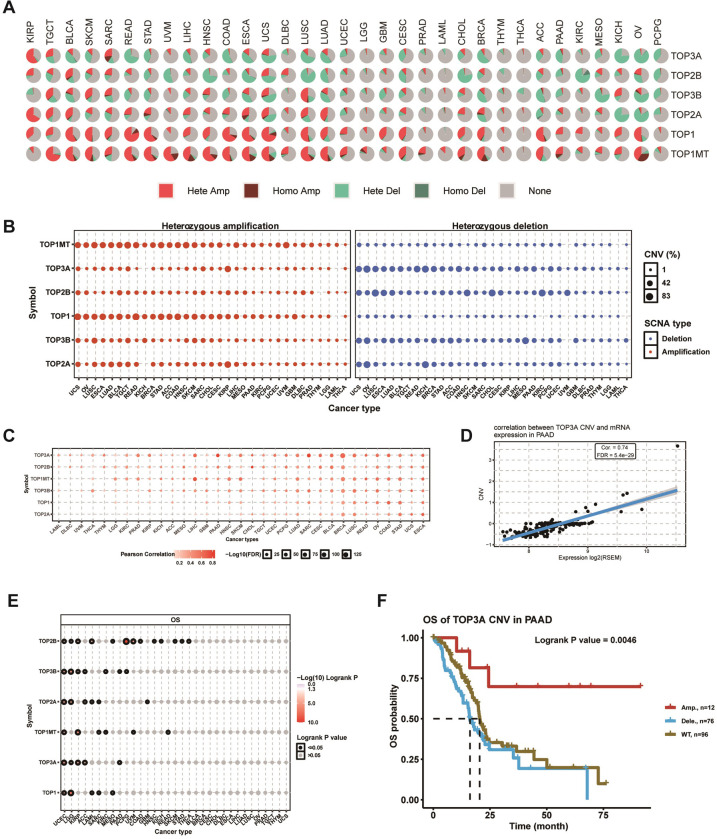
Fig 4. CNV analysis of topoisomerase family genes.
(A) CNV pie chart showed the composition of heterozygous / homozygous CNV of topoisomerase family genes in different cancer types. (B) The heterozygous CNV diagram showed the percentage of heterozygous amplification (red bubbles) and deletions (blue bubbles) of topoisomerase family genes in different types of cancer. The bubble size positively correlated with percentage. (C) Correlation between CNV level and gene expression of topoisomerase family in different types of cancer. (D) Scatter diagram showed the relationship between TOP3A CNV and its mRNA expression in PAAD. (E) CNV survival analysis of topoisomerase family genes in different types of cancer. (F) Kaplan-Meier curve showing the survival difference between different CNV types and wild type of TOP3A in PAAD.

