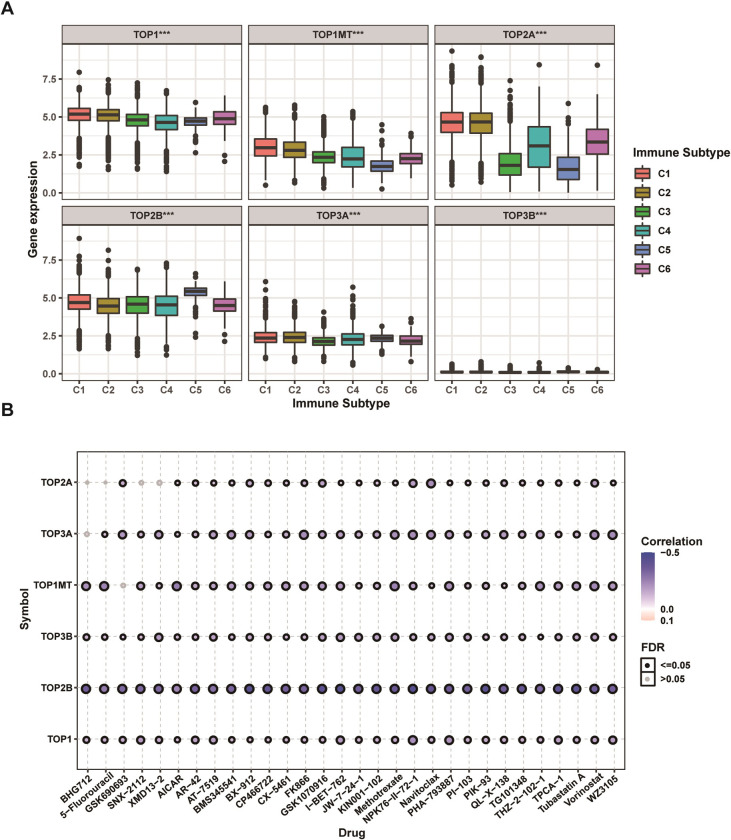
Fig 7. Immune subtype and drug sensitivity analysis of topoisomerase family genes.
(A) Differential expression of topoisomerase family genes in six pan-cancer immune subtypes. (B) Bubble diagram of the relationship between drug sensitivity (IC50) and gene expression level of topoisomerase family genes in CTRP database. Positive correlation (red bubble) indicates one gene with high expression was resistant to a drug, while negative correlation (blue bubble) indicates one gene with high expression was sensitive to a drug. The color depth and size of bubble are positively correlated with the correlation coefficient and the FDR significance, respectively. Black outline border indicates FDR≤0.05.

